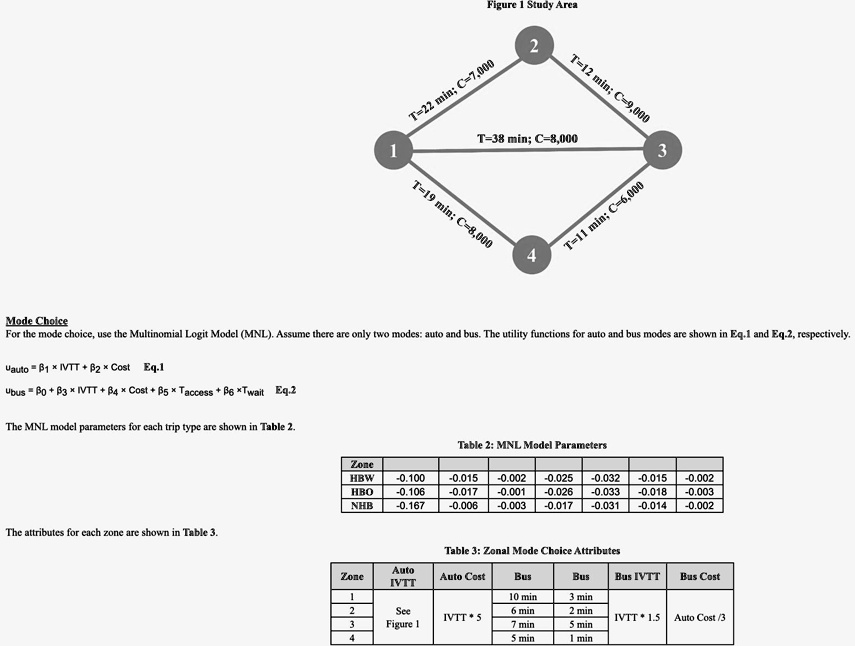
Figure 1 Study Area
Mode Choice
For the mode choice, use the Multinomial Logit Model (MNL). Assume there are only two modes: auto and bus. The utility functions for auto and bus modes are shown in Eq. 1 and Eq. 2, respectively.
The MNL model parameters for each trip type are shown in Table 2.
Table 2: MNL Model Parameters
able[[Zone,,,,,,,],[HBW,-0.100,-0.015,-0.002,-0.025,-0.032,-0.015,-0.002],[HBO,-0.106,-0.017,-0.001,-0.026,-0.033,-0.018,-0.003],[NHB,-0.167,-0.006,-0.003,-0.017,-0.031,-0.014,-0.002]]
The attributes for each zone are shown in Table 3.
Table 3: Zonal Mode Choice Attributes
able[[Zone, able[[Auto],[IVTT]],Auto Cost,Bus,Bus,Bus IVTT,Bus Cost],[1, able[[See],[Figure 1]],IVTT * 5,10 min,3 min,IVTT * 1.5,Auto Cost / 3
Figure 1 Study Area
9,000
T=38 min; C=8,000
3
T=19 = 8,000
000
min;
Mode Choice For the mode choice, use the Multinomial Logit Model (MNL). Assume there are only two modes: auto and bus. The utility functions for auto and bus modes are shown in Eq. 1 and Eq. 2, respectively.
Uauto = IVTT + 2Cost Eq. 1 ubus = 0.3IVTT + 4Cost + 5Taccess + Twait Eq. 2
The MNL model parameters for each trip type are shown in Table 2.
Table 2: MNL Model Parameters
Zone HBW HBO NHB
-0.100 -0.106 -0.167
-0.015 -0.002 -0.025 -0.032 -0.015 -0.002 -0.017 -0.001 -0.026 -0.033 -0.018 -0.003 -0.006 -0.003 -0.017 -0.031 -0.014 -0.002
The attributes for each zone are shown in Table 3
Table 3: Zonal Mode Choice Attributes
Zone 1 2 3 4
Auto IVTT
Auto Cost
Bus 10 min 6 min 7 min 5 min
Bus 3 min 2 min 5 min 1 min
Bus IVTT
Bus Cost
See Figure 1
IVTT * 5
IVTT * 1.5
Auto Cost / 3