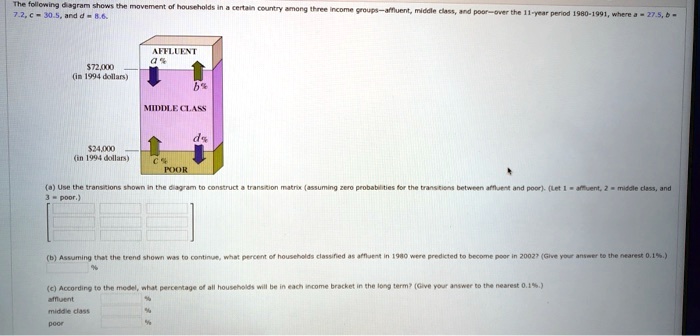
The following diagram shows the movement of households in a certain country among three income groups-affluent, middle class, and poor-over the 11-year period 1980-1991, where a = 27.5, b = 7.2, c = 30.5, and d = 8.6.
$72,000
(in 1994 dollars)
$24,000
AFFLUENT
a%
b%
MIDDLE CLASS
d%
(in 1994 dollars)
C%
POOR
(a) Use the transitions shown in the diagram to construct a transition matrix (assuming zero probabilities for the transitions between affluent and poor). (Let 1 = affluent, 2 = middle class, and 3 = poor.)
(b) Assuming that the trend shown was to continue, what percent of households classified as affluent in 1980 were predicted to become poor in 2002? (Give your answer to the nearest 0.1%).
%
(c) According to the model, what percentage of all households will be in each income bracket in the long term? (Give your answer to the nearest 0.1%).
affluent
middle class
poor
%
%
%