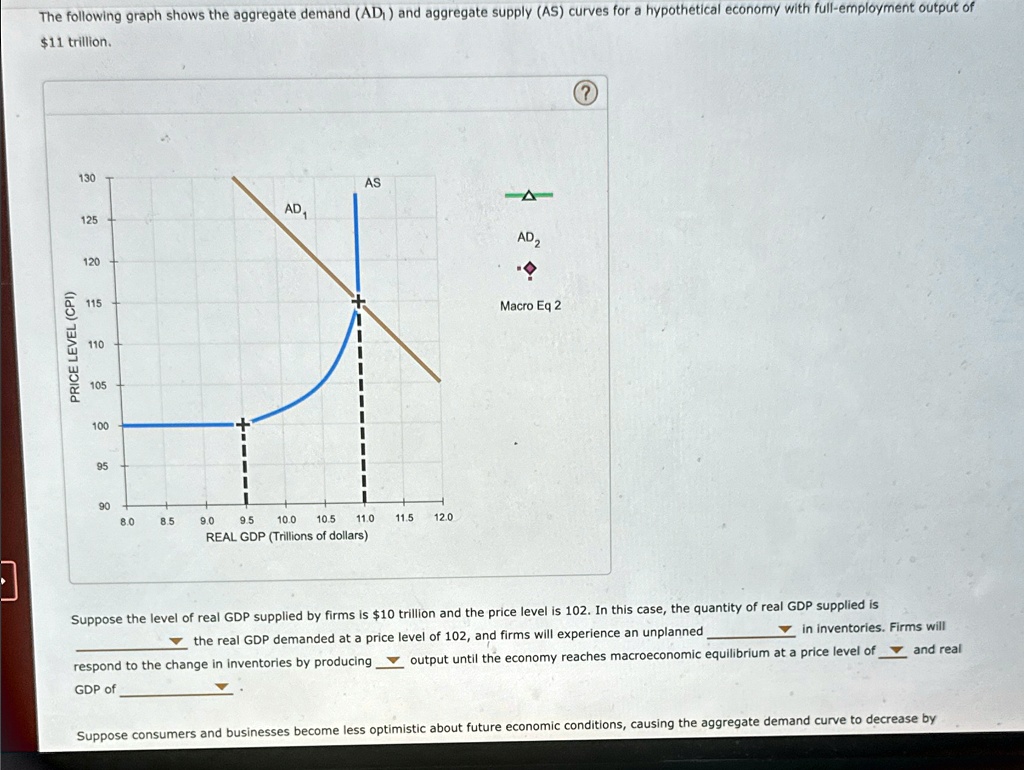
The following graph shows the aggregate demand (AD) and aggregate supply (AS) curves for a hypothetical economy with full-employment output of
$11 trillion.
PRICE LEVEL (CPI)
130
AS
AD1
125
120
115
110
105
100
95
90
8.0
8.5
9.0
9.5
10.0
10.5
11.0
11.5
12.0
REAL GDP (Trillions of dollars)
AD2
Macro Eq 2
Suppose the level of real GDP supplied by firms is $10 trillion and the price level is 102. In this case, the quantity of real GDP supplied is
the real GDP demanded at a price level of 102, and firms will experience an unplanned
in inventories. Firms will
respond to the change in inventories by producing
output until the economy reaches macroeconomic equilibrium at a price level of
and real
GDP of
Suppose consumers and businesses become less optimistic about future economic conditions, causing the aggregate demand curve to decrease by