apter 12 Assignment
Assignment: Chapter 12 Assignment
Questions Problem 12-12 w_StatTools (Regression-Based Trend Models)
Spreadsheet
eBook
Assignment Score: 42.05%
Submit Assignment for Grading
Question 1 of 3
Check My Work
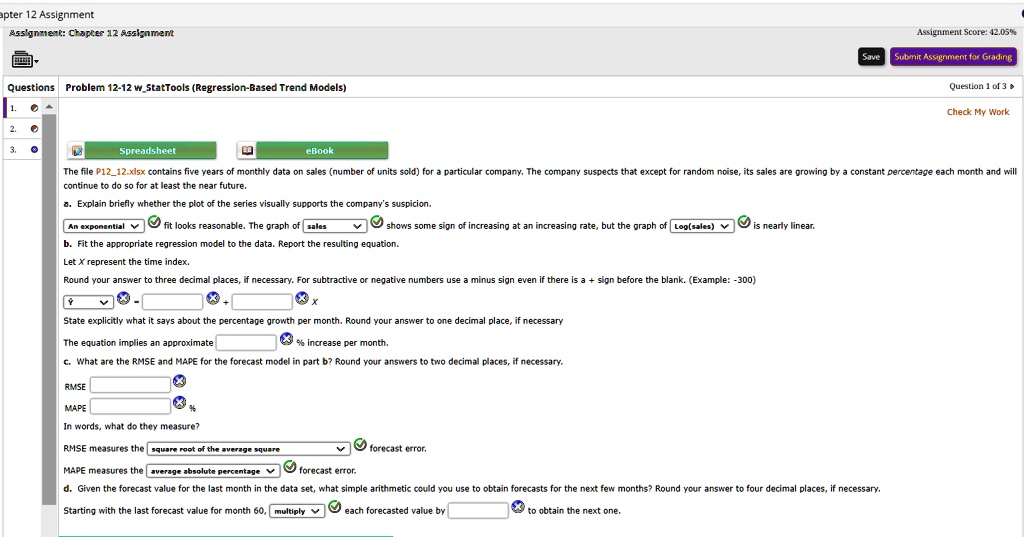
The file P12_12.xlsx contains five years of monthly data on sales (number of units sold) for a particular company. The company suspects that except for random noise, its sales are growing by a constant percentage each month and will
continue to do so for at least the near future.
a. Explain briefly whether the plot of the series visually supports the company's suspicion.
An exponential
fit looks reasonable. The graph of sales
shows some sign of increasing at an increasing rate, but the graph of Log(sales)
is nearly linear.
b. Fit the appropriate regression model to the data. Report the resulting equation.
Let X represent the time index.
Round your answer to three decimal places, if necessary. For subtractive or negative numbers use a minus sign even if there is a + sign before the blank. (Example: -300)
+
x
State explicitly what it says about the percentage growth per month. Round your answer to one decimal place, if necessary
The equation implies an approximate
3% increase per month.
c. What are the RMSE and MAPE for the forecast model in part b? Round your answers to two decimal places, if necessary.
RMSE
MAPE
In words, what do they measure?
RMSE measures the square
of the
MAPE measures the average absolute percentage
forecast error.
forecast error.
d. Given the forecast value for the last month in the data set, what simple arithmetic could you use to obtain forecasts for the next few months? Round your answer to four decimal places, if necessary.
Starting with the last forecast value for month 60, multiply each forecasted value by
to obtain the next one.