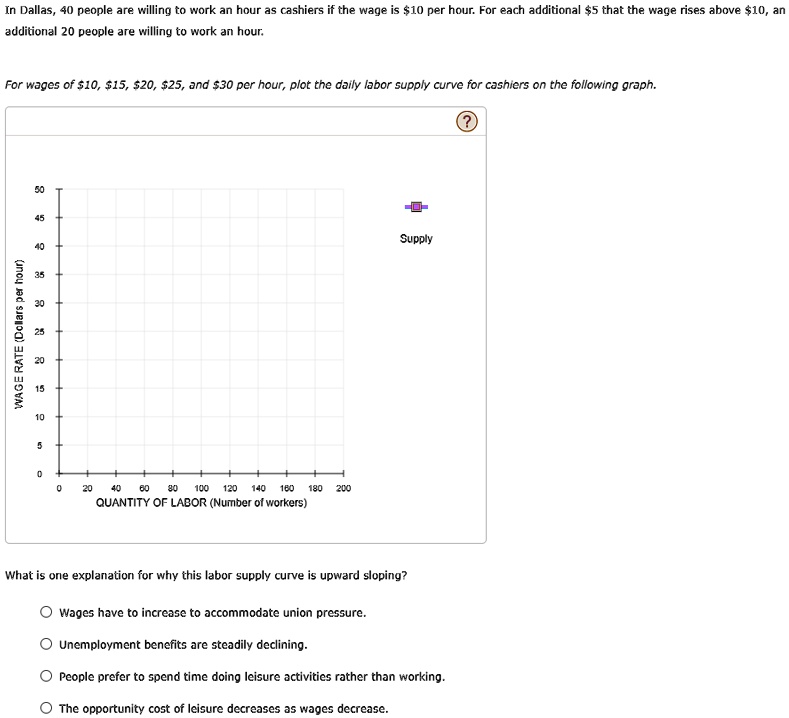
In Dallas, 40 people are willing to work an hour as cashiers if the wage is $10 per hour. For each additional $5 that the wage rises above $10, an additional 20 people are willing to work an hour.
For wages of $10, $15, $20, $25, and $30 per hour, plot the daily labor supply curve for cashiers on the following graph.
50
45
WAGE RATE (Dollars per hour)
15
20
2
20
35
30
25
10
5
0
0
20
40 60 80 100 120 140 160 180 200
QUANTITY OF LABOR (Number of workers)
Supply
What is one explanation for why this labor supply curve is upward sloping?
Wages have to increase to accommodate union pressure.
Unemployment benefits are steadily declining.
People prefer to spend time doing leisure activities rather than working.
The opportunity cost of leisure decreases as wages decrease.