Z-7
ART IV Graphing
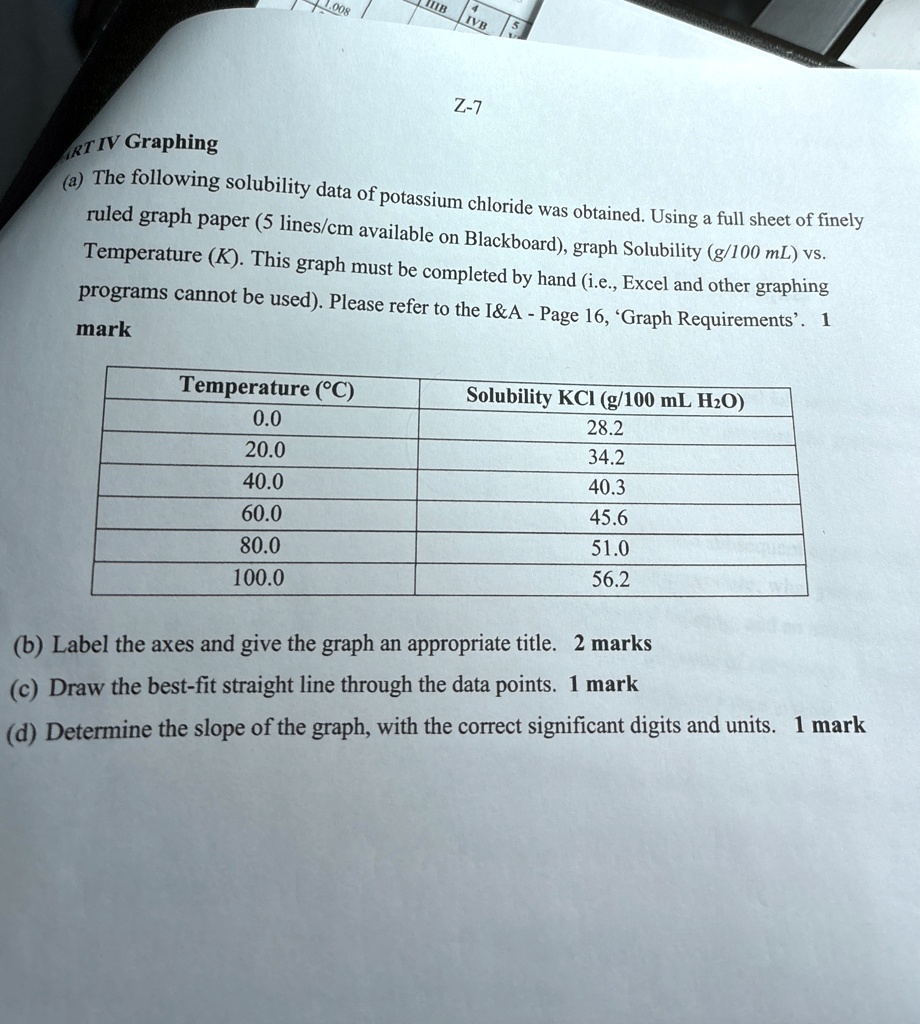
(a) The following solubility data of potassium chloride was obtained. Using a full sheet of finely
ruled graph paper (5 lines/cm available on Blackboard), graph Solubility (g/100 mL) vs.
Temperature (K). This graph must be completed by hand (i.e., Excel and other graphing
programs cannot be used). Please refer to the I&A - Page 16, 'Graph Requirements'. 1
mark
Temperature (°C)
Solubility KCl (g/100 mL H$_2$O)
0.0
28.2
20.0
34.2
40.0
40.3
60.0
45.6
80.0
51.0
100.0
56.2
(b) Label the axes and give the graph an appropriate title. 2 marks
(c) Draw the best-fit straight line through the data points. 1 mark
(d) Determine the slope of the graph, with the correct significant digits and units. 1 mark