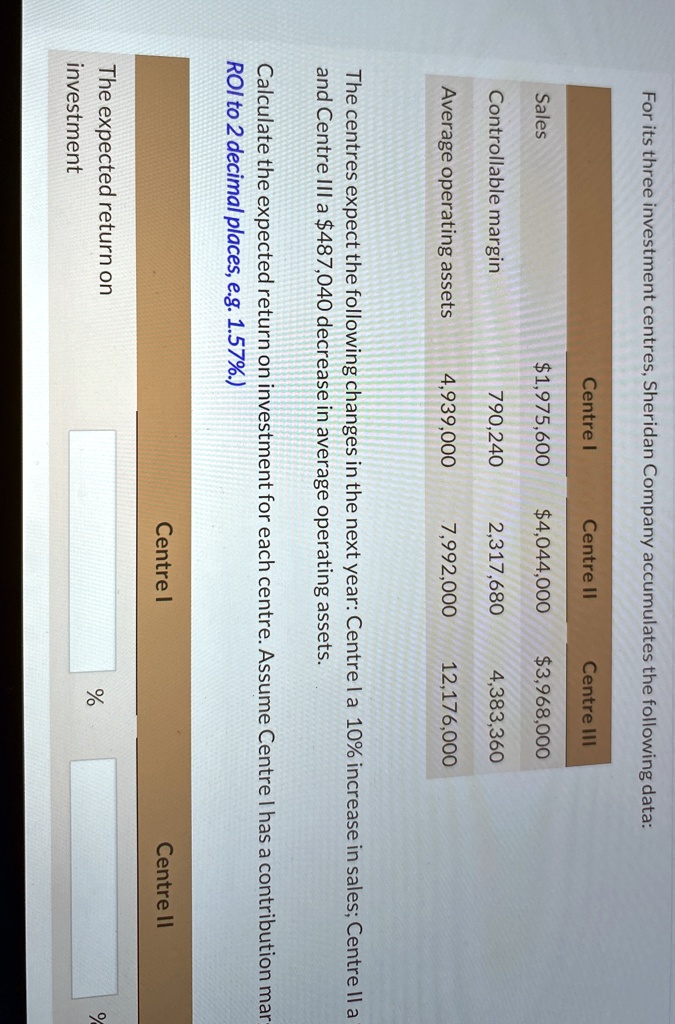
For its three investment centres, Sheridan Company accumulates the following data:
Sales
Controllable margin
Average operating assets
Centre I
Centre II
Centre III
$1,975,600
$4,044,000
$3,968,000
790,240
2,317,680
4,383,360
4,939,000
7,992,000
12,176,000
The centres expect the following changes in the next year: Centre l a 10% increase in sales; Centre II a
and Centre III a $487,040 decrease in average operating assets.
Calculate the expected return on investment for each centre. Assume Centre I has a contribution mar
ROI to 2 decimal places, e.g. 1.57%.)
The expected return on
investment
Centre I
%
Centre II
%