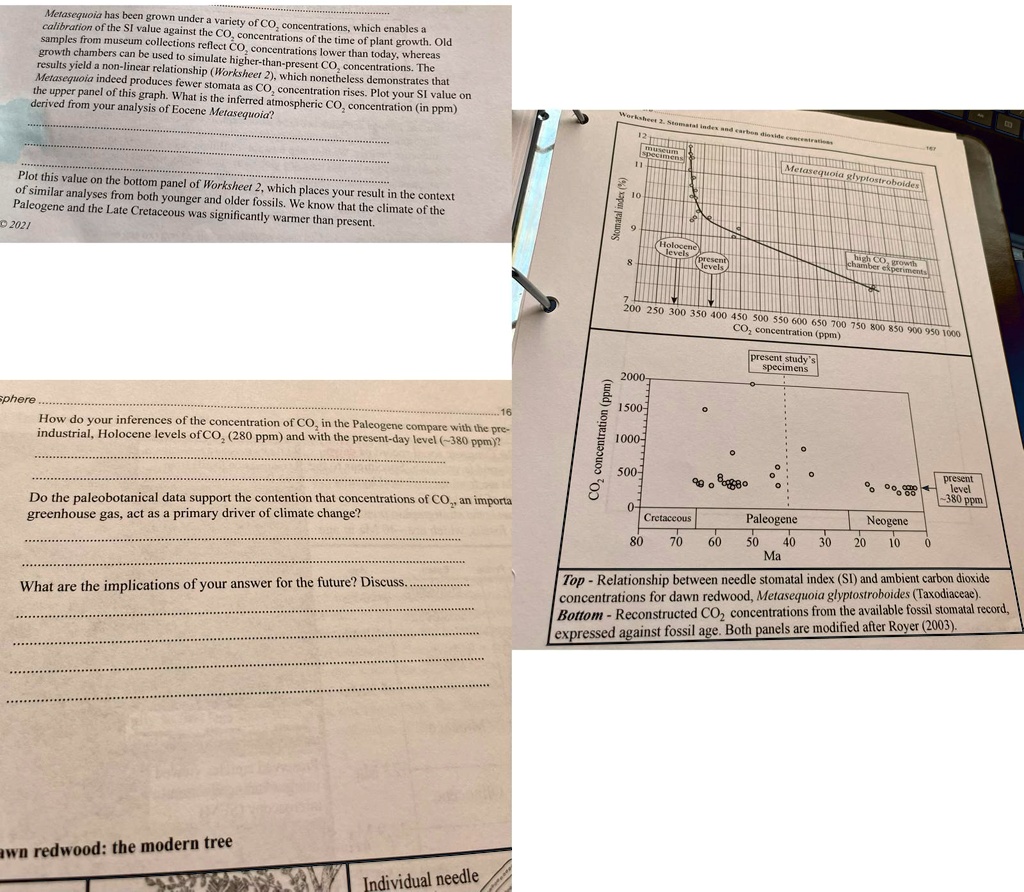
Top - Relationship between needle stomatal index (SI) and ambient carbon dioxide concentrations for dawn redwood, Metasequoia glyptostroboides (Taxodiaceae).
Bottom - Reconstructed CO2 concentrations from the available fossil stomatal record, expressed against fossil age. Both panels are modified after Royer (2003).
Results yield a non-linear relationship (Worksheet 2), which nonetheless demonstrates that derived from your analysis of Eocene Metasequoia the upper panel of this graph. What is the inferred atmospheric CO2 concentration (in ppm)?
Plot this value on the bottom panel of Worksheet 2, which places your result in the context of similar analyses from both younger and older fossils. We know that the climate of the 2021 Paleogene and the Late Cretaceous was significantly warmer than present.
CO2 concentration (ppm present study's specimens
2000 1500 concentration (ppm) 1000 500 CO2 8.88 0.00000 380 ppm Cretaceous Paleogene Neogene 80 70 60 50 40 30 20 10 Ma Top - Relationship between needle stomatal index (SI) and ambient carbon dioxide concentrations for dawn redwood, Metasequoia glyptostroboides (Taxodiaceae) Bottom - Reconstructed CO2 concentrations from the available fossil stomatal record expressed against fossil age. Both panels are modified after Royer (2003).
How do your inferences of the concentration of CO2 in the Paleogene compare with the pre-industrial, Holocene levels of CO2 280 ppm and with the present-day level (~380 ppm)?
Do the paleobotanical data support the contention that concentrations of CO2, an important greenhouse gas, act as a primary driver of climate change?
What are the implications of your answer for the future? Discuss...
Dawn redwood: the modern tree
Individual needle