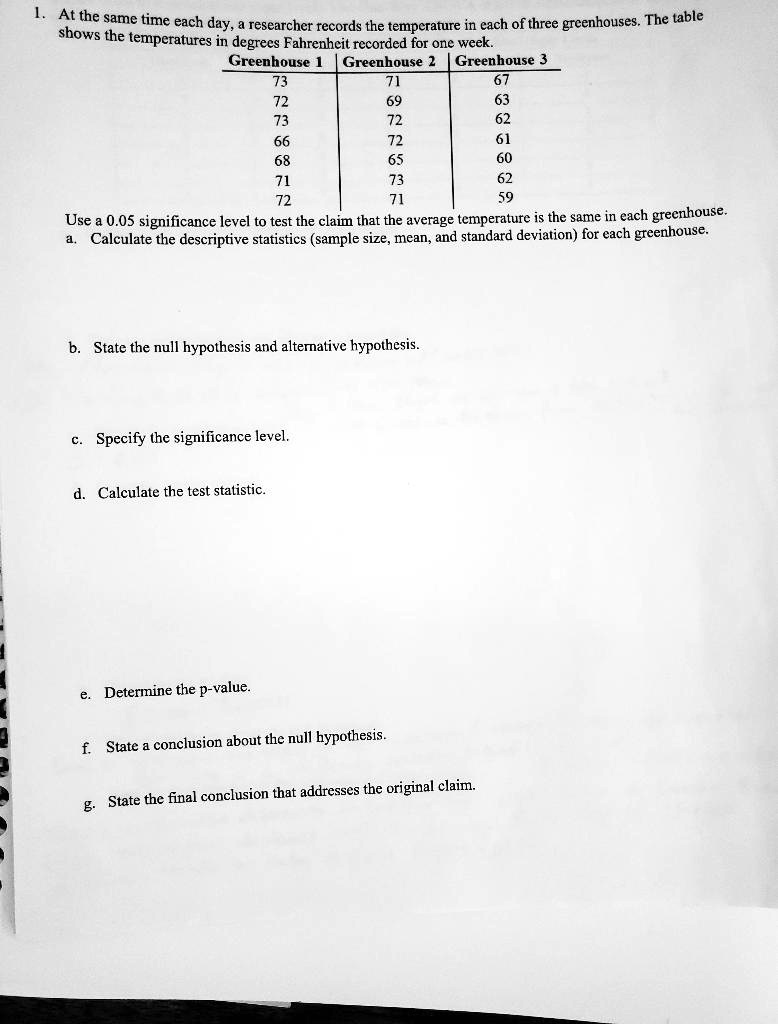
1. At the same time each day, a researcher records the temperature in each of three greenhouses. The table shows the temperatures in degrees Fahrenheit recorded for one week.
Greenhouse 1 Greenhouse 2 Greenhouse 3
73
71
67
72
69
63
73
72
62
66
72
61
68
65
60
71
73
62
72
71
59
Use a 0.05 significance level to test the claim that the average temperature is the same in each greenhouse.
a. Calculate the descriptive statistics (sample size, mean, and standard deviation) for each greenhouse.
b. State the null hypothesis and alternative hypothesis.
c. Specify the significance level.
d. Calculate the test statistic.
e. Determine the p-value.
f. State a conclusion about the null hypothesis.
g. State the final conclusion that addresses the original claim.