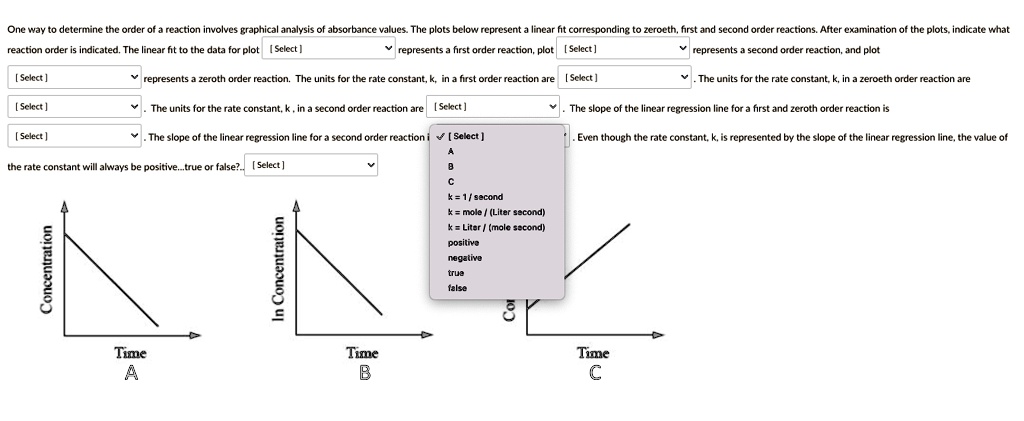
One way to determine the order of a reaction involves graphical analysis of absorbance values. The plots below represent a linear fit corresponding to zeroeth, first and second order reactions. After examination of the plots, indicate what reaction order is indicated. The linear fit to the data for plot [Select] represents a first order reaction, plot [Select] represents a zeroth order reaction. The units for the rate constant, k, in a first order reaction are [Select] represents a second order reaction, and plot [Select] The units for the rate constant, k, in a zeroeth order reaction are [Select] The units for the rate constant, k, in a second order reaction are [Select] The slope of the linear regression line for a first and zeroth order reaction is [Select] . The slope of the linear regression line for a second order reaction i [Select] . Even though the rate constant, k, is represented by the slope of the linear regression line, the value of the rate constant will always be positive...true or false?. [Select] A B C k = 1/second Concentration Time A In Concentration Time B k = mole / (Liter second) k = Liter/(mole second) positive negative true false Time C