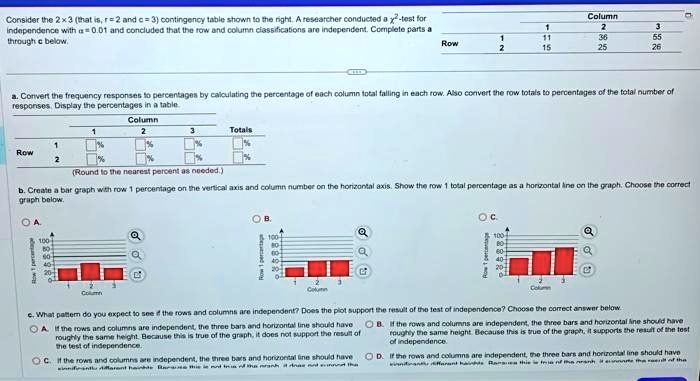
Consider the 2x3 (that is, r=2 and c=3) contingency table shown to the right. A researcher conducted a $\chi^2$-test for independence with $\alpha = 0.01$ and concluded that the row and column classifications are independent. Complete parts a through c below.
Column
1
2
3
Row
1
11
36
55
2
15
25
26
a. Convert the frequency responses to percentages by calculating the percentage of each column total falling in each row. Also convert the row totals to percentages of the total number of responses. Display the percentages in a table.
Column
1
2
3
Totals
Row
1
%
%
%
%
2
%
%
%
%
(Round to the nearest percent as needed.)
b. Create a bar graph with row 1 percentage on the vertical axis and column number on the horizontal axis. Show the row 1 total percentage as a horizontal line on the graph. Choose the correct graph below.
OA.
100-
Row 1 percentage
Column
OB.
Row 1 percentage
100-
Column
OC.
Row 1 percentage
100-
Column
c. What pattern do you expect to see if the rows and columns are independent? Does the plot support the result of the test of independence? Choose the correct answer below.
A. If the rows and columns are independent, the three bars and horizontal line should have roughly the same height. Because this is true of the graph, it does not support the result of the test of independence.
C. If the rows and columns are independent, the three bars and horizontal line should have
B. If the rows and columns are independent, the three bars and horizontal line should have roughly the same height. Because this is true of the graph, it supports the result of the test of independence.
OD. If the rows and columns are independent, the three bars and horizontal line should have