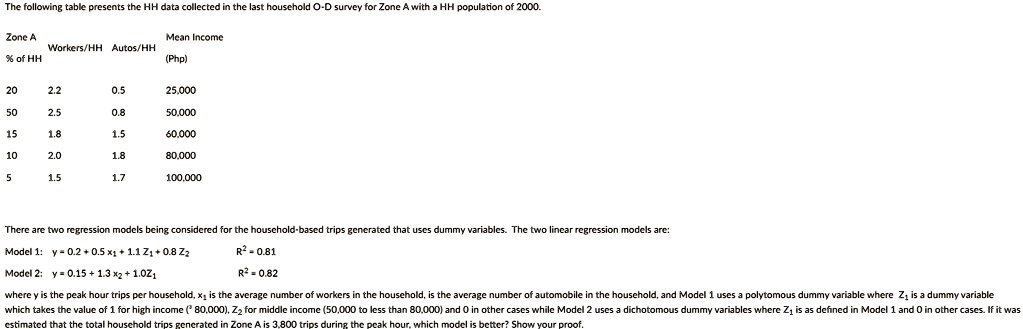
The following table presents the HH data collected in the last household O-D survey for Zone A with a HH population of 2000.
Zone A
Mean Income
Workers/HH Autos/HH
% of HH
(Php)
20
2.2
0.5
25,000
50
2.5
0.8
50.000
15
1.8
1.5
60,000
10
2.0
1.8
80.000
5
1.5
1.7
100,000
There are two regression models being considered for the household-based trips generated that uses dummy variables. The two linear regression models are:
Model 1: $y = 0.2 + 0.5 x_1 + 1.1 Z_1 + 0.8 Z_2$
Model 2: $y = 0.15 + 1.3 x_2 + 1.0Z_1$
$R^2 = 0.81$
$R^2 = 0.82$
where y is the peak hour trips per household, $x_1$ is the average number of workers in the household, is the average number of automobile in the household, and Model 1 uses a polytomous dummy variable where $Z_1$ is a dummy variable
which takes the value of 1 for high income ($\geq$ 80,000), $Z_2$ for middle income (50,000 to less than 80,000) and 0 in other cases while Model 2 uses a dichotomous dummy variables where $Z_1$ is as defined in Model 1 and 0 in other cases. If it was
estimated that the total household trips generated in Zone A is 3,800 trips during the peak hour, which model is better? Show your proof.