Please answer the questions on the right.
RAM
File Edit Code
Plots Session Build Debug Profile Tools Help
Go to file/function
suippv
R4.3.2
Assignments
Untitled1*
Environment History Connections Tut 191MiB C RGlobal Environment Data O cdc 20000 obs. of 9 variabl... O fdata 10431 obs.of 9 variabl. O mdata 9569 obs. of 9 variables Values bmi num [1:20000] 25.1 21.5 2.
Make a scatterplot of weight versus desired weight
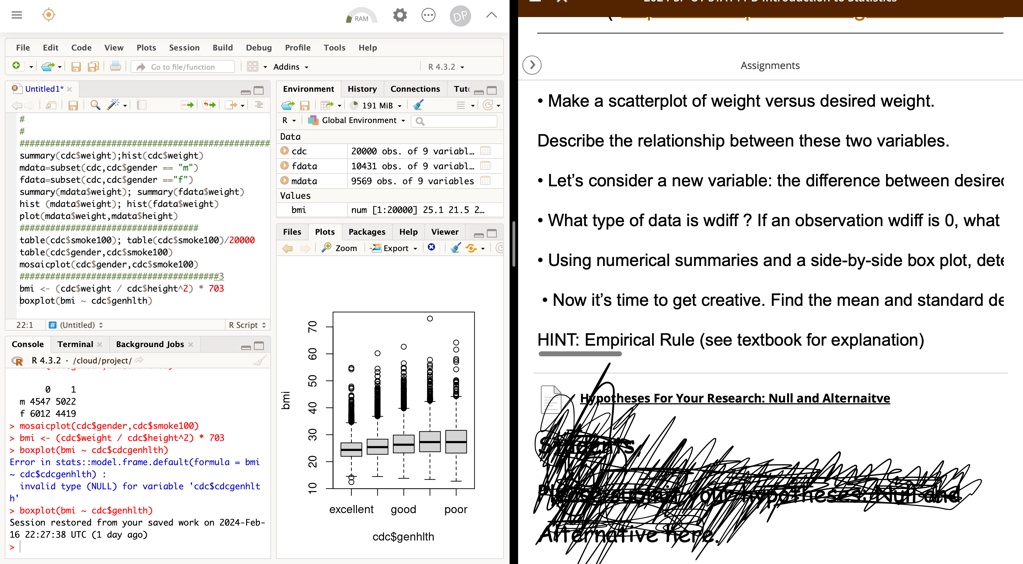
############ Summary(cdcSweight);hist(cdcSweight) mdata-subset(cdc,cdc$gender == m) fdata=Subset(cdc,cdcSgender ==f) summary(mdata$weight); summary(fdataSweight) hist (mdata$weight); hist(fdata$weight) plot(mdata$weight,mdataSheight) ################################### table(cdc$smoke10); table(cdc$smokel00)/20000 table(cdc$gender,cdcSsmoke106) mosaicplot(cdcSgender,cdcSsmoke106) #######################################3 bmi <- (cdc$weight / cdc$height^2) * 703 boxplot(bmi~ cdcSgenhlth)
Describe the relationship between these two variables
Let's consider a new variable:the difference between desire
What type of data is wdiff If an observation wdiff is O,what
Files Plots Packages Help Viewer Zoom od .
- Using numerical summaries and a side-by-side box plot, dete
Now it's time to get creative. Find the mean and standard de
22:1 (Untitled
R Script
2
0
Console Terminal Background Jobs RR 4.3.2 - /cloud/project/
HINT: Empirical Rule (see textbook for explanation)
-
m 4547 5022 f 6012 4419 > mosaicplot(cdc$gender,cdc$smokele0) > bmi <- (cdc$weight / cdc$height^2) * 703 > boxplot(bmi~ cdc$cdcgenhlth) Error in stats::model.frame.default(formula = bmi cdc$cdcgenhlth invalid type (NULL) for variable 'cdc$cdcgenhlt
bmi 0
For Your Research:Null and Alternaitve
2 8 0 excellent good
> boxplot(bmi ~ cdc$genhlth) Session restored from your saved work on 2024-Feb- 16 22:27:38 UTC 1 day ago >
poor
cdc$genhlth