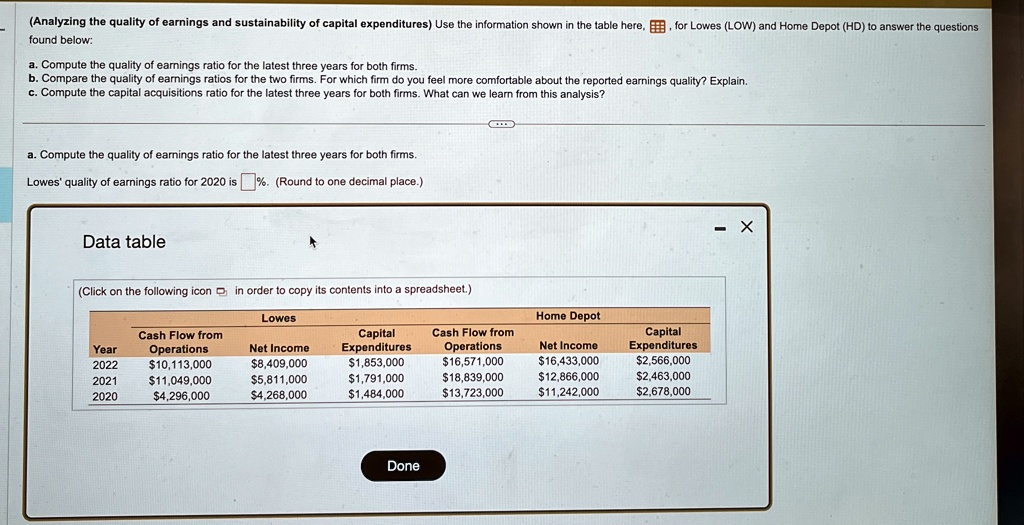
(Analyzing the quality of earnings and sustainability of capital expenditures) Use the information shown in the table here,, for Lowes (LOW) and Home Depot (HD) to answer the questions
found below:
a. Compute the quality of earnings ratio for the latest three years for both firms.
b. Compare the quality of earnings ratios for the two firms. For which firm do you feel more comfortable about the reported earnings quality? Explain.
c. Compute the capital acquisitions ratio for the latest three years for both firms. What can we learn from this analysis?
a. Compute the quality of earnings ratio for the latest three years for both firms.
Lowes' quality of earnings ratio for 2020 is %. (Round to one decimal place.)
Data table
(Click on the following icon in order to copy its contents into a spreadsheet.)
Lowes
Home Depot
Cash Flow from
Capital
Cash Flow from
Year
Operations
Net Income
Expenditures
Operations
Net Income
Capital
Expenditures
2022
$10,113,000
$8,409,000
$1,853,000
$16,571,000
$16,433,000
$2,566,000
2021
$11,049,000
$5,811,000
$1,791,000
$18,839,000
$12,866,000
$2,463,000
2020 $4,296,000
$4,268,000
$1,484,000
$13,723,000
$11,242,000
$2,678,000
Done
X