Ace - AI Tutor
Ask Our Educators
Textbooks
My Library
Flashcards
Scribe - AI Notes
Notes & Exams
Download App
Brittina Andrews

Brittina A.

Divider

Questions asked

ANSWERED

Lucas Finney verified

Numerade educator

The citizens of a certain community were asked to choose their favorite pet. The pie chart below shows the distribution of the citizens' answers. If there are 125,000 citizens in the community, how many chose Hamsters or Birds?

View Answer
divider
ANSWERED

Lucas Finney verified

Numerade educator

Here are the shopping times (in minutes) for each of sixteen shoppers at a local grocery store. Shopping times (in minutes) 33 20 21 34 32 31 23 26 24 25 30 16 20 35 33 29 (a) Complete the grouped frequency distribution for the data. (Note that the class width is 4.) Shopping times (in minutes) Frequency 15.5 to 19.5 19.5 to 23.5 23.5 to 27.5 27.5 to 31.5 31.5 to 35.5 (b) Using the classes from part (a), draw the frequency polygon for the data. Note that you can add or remove classes from the figure. Label each class with its midpoint. Frequency 6- 5- 4- 3- 2- 1- 0 Shopping times (in minutes)

View Answer
divider
ANSWERED

Sheryl Ezze verified

Numerade educator

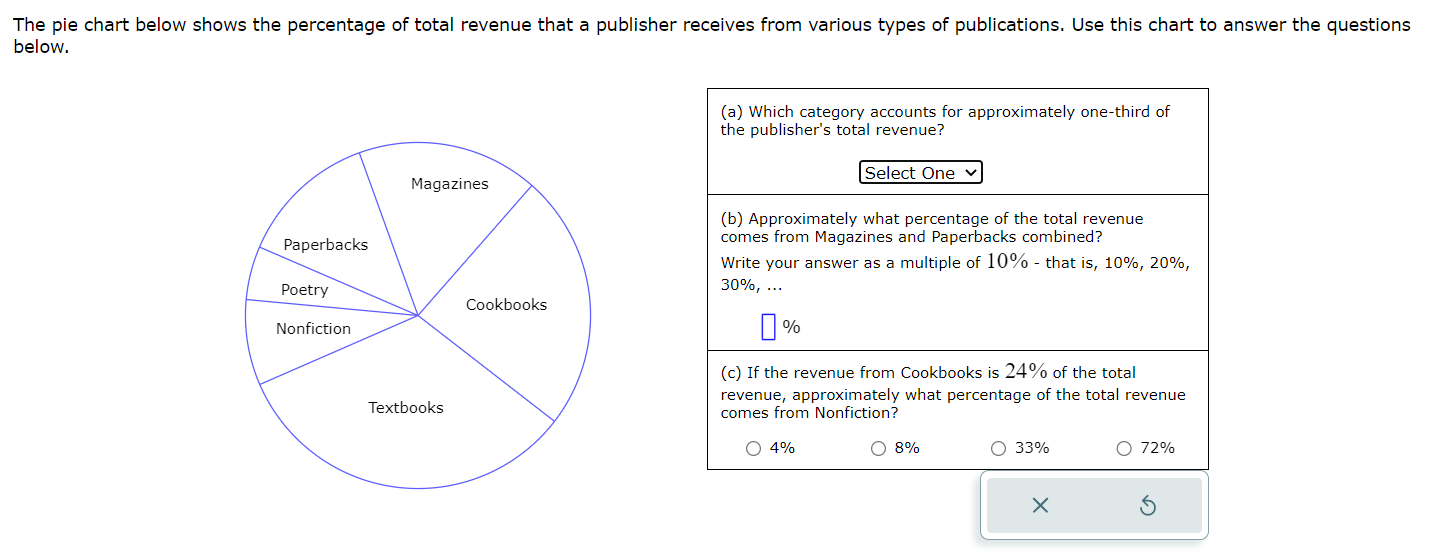
The pie chart below shows the percentage of total revenue that a publisher receives from various types of publications. Use this chart to answer the questions below. Magazines Paperbacks Poetry Nonfiction Textbooks Cookbooks (a) Which category accounts for approximately one-third of the publisher's total revenue? Select One (b) Approximately what percentage of the total revenue comes from Magazines and Paperbacks combined? Write your answer as a multiple of 10% - that is, 10%, 20%, 30%, ... % (c) If the revenue from Cookbooks is 24% of the total revenue, approximately what percentage of the total revenue comes from Nonfiction? 4% 8% 33% 72%

View Answer
divider
ANSWERED

Lucas Finney verified

Numerade educator

The pie chart below shows how the total annual income for a certain family is spent. If the amount budgeted for Food and Clothing combined is ( $ 27,000 ), what is the total family income?

View Answer
divider
ANSWERED

Lucas Finney verified

Numerade educator

Burns Corporation has four departments. The double bar graph below shows how many male and female employees are in each department. Use this graph to answer the questions. (a) Estimate the number of males in Production. males (b) Which departments have more females than males? Check all that apply. Advertising Marketing Production Accounting (c) Which department has the fewest employees total? Advertising Marketing Production Accounting

View Answer
divider
ANSWERED

Clarissa Barr verified

Numerade educator

Fifteen cyclists were each asked the number of miles they biked last week. Their responses are given below. Number of miles 12 18 9 13 12 19 7 2 10 17 3 2 2 8 15 Send data to calculator (a) Complete the grouped frequency distribution for the data. (Note that the class width is 5.) Number of miles Frequency 0.5 to 5.5 5.5 to 10.5 10.5 to 15.5 15.5 to 20.5 (b) Using the classes from part (a), draw the frequency polygon for the data. Note that you can add or remove classes from the figure. Label each class with its midpoint. Frequency 5 4 3 2 1 0 Number of miles

View Answer
divider
ANSWERED

Sheryl Ezze verified

Numerade educator

Let ( A ) and ( B ) be two events such that ( P(A)=0.01 ) and ( P(B)=0.94 ). Do not round your responses. (If necessary, consult a list of formulas.) (a) Determine ( P(A cup B) ), given that ( A ) and ( B ) are independent. (b) Determine ( P(A cup B) ), given that ( A ) and ( B ) are mutually exclusive.

View Answer
divider
ANSWERED

Robin Corrigan verified

Numerade educator

In the Venn diagram below, A, B, and C are events in the sample space S. (Note: For any event X, we use ? to denote "not X.") Shade C ? (? ? B?) on the Venn diagram. S A B C

View Answer
divider
ANSWERED

Prabhakar Kumar verified

Numerade educator

The pie chart below shows how the annual budget for a certain company is divided by department. If the total budget is ( $ 100,000,000 ), what amount is budgeted for Support, Research, and Editorial combined?

View Answer
divider
ANSWERED

Prabhakar Kumar verified

Numerade educator

In the Venn Diagram below, ( C ) and ( D ) are events in the sample space ( S ). (Note: For any event ( X ), we use ( ar{X} ) to denote "not ( X ).") Shade ( ar{C} cap D ) on the Venn diagram.

View Answer
divider