Question 3
1.5 pts
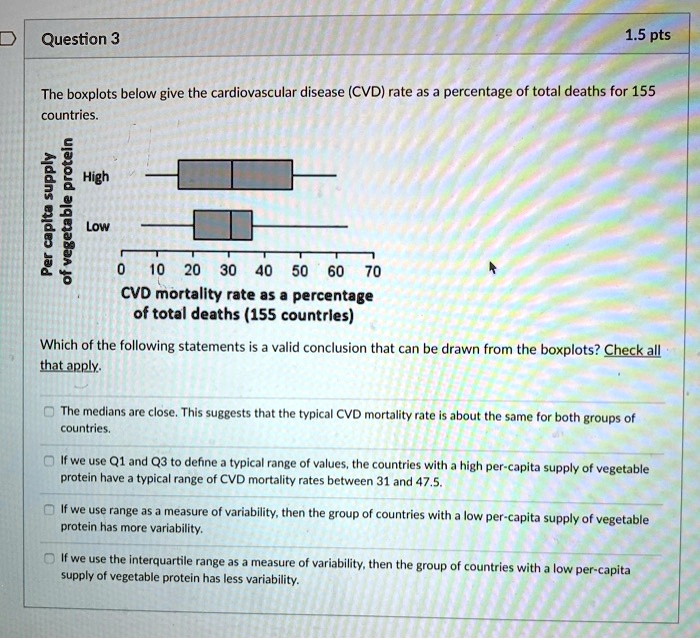
The boxplots below give the cardiovascular disease (CVD) rate as a percentage of total deaths for 155
countries.
High
Per capita supply
of vegetable protein
Low
0 10 20 30 40 50 60 70
CVD mortality rate as a percentage
of total deaths (155 countries)
Which of the following statements is a valid conclusion that can be drawn from the boxplots? Check all
that apply.
The medians are close. This suggests that the typical CVD mortality rate is about the same for both groups of
countries.
If we use Q1 and Q3 to define a typical range of values, the countries with a high per-capita supply of vegetable
protein have a typical range of CVD mortality rates between 31 and 47.5.
If we use range as a measure of variability, then the group of countries with a low per-capita supply of vegetable
protein has more variability.
If we use the interquartile range as a measure of variability, then the group of countries with a low per-capita
supply of vegetable protein has less variability.