TABLE 5-3
Total Units 1 2 3 4 5 6 7 8
Apples
Apples
Bananas
Bananas
Cherries
Cherries
(Total Utility) (Marginal Utility) (Total Utility) (Marginal Utility) (Total Utility) (Marginal Utility)
10 100 6 19 150 12 27 175 18 187 24 40 193 30 45 196 49 197 42 52 197 48
B. Derivation of Demand Curves
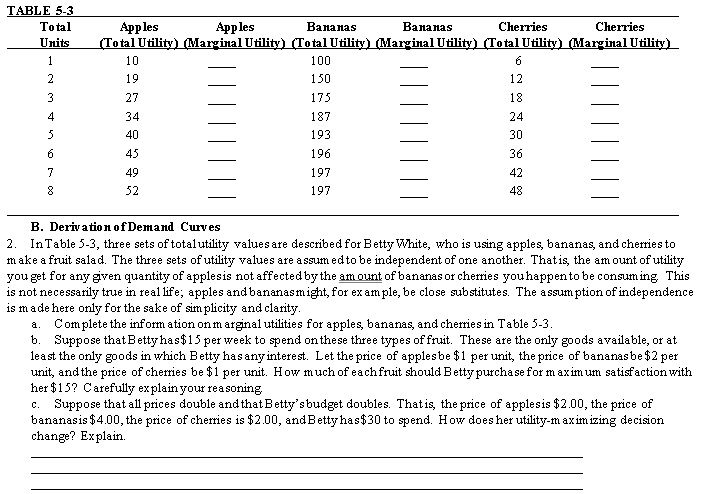
In Table 5-3, three sets of total utility values are described for Betty White, who is using apples, bananas, and cherries to make a fruit salad. The three sets of utility values are assumed to be independent of one another. That is, the amount of utility you get for any given quantity of apples is not affected by the amount of bananas or cherries you happen to be consuming. This is not necessarily true in real life; apples and bananas might, for example, be close substitutes. The assumption of independence is made here only for the sake of simplicity and clarity.
a. Complete the information on marginal utilities for apples, bananas, and cherries in Table 5-3.
b. Suppose that Betty has $15 per week to spend on these three types of fruit. These are the only goods available, or at least the only goods in which Betty has any interest. Let the price of apples be $1 per unit, the price of bananas be $2 per unit, and the price of cherries be $1 per unit. How much of each fruit should Betty purchase for maximum satisfaction with her $15? Carefully explain your reasoning.
c. Suppose that all prices double and that Betty's budget doubles. That is, the price of apples is $2.00, the price of bananas is $4.00, the price of cherries is $2.00, and Betty has $30 to spend. How does her utility-maximizing decision change? Explain.