Return on Sales Percen... Gross Margin Percenta...
Tableau Dashboard Activity 4-1: Multi-Step Income Statements
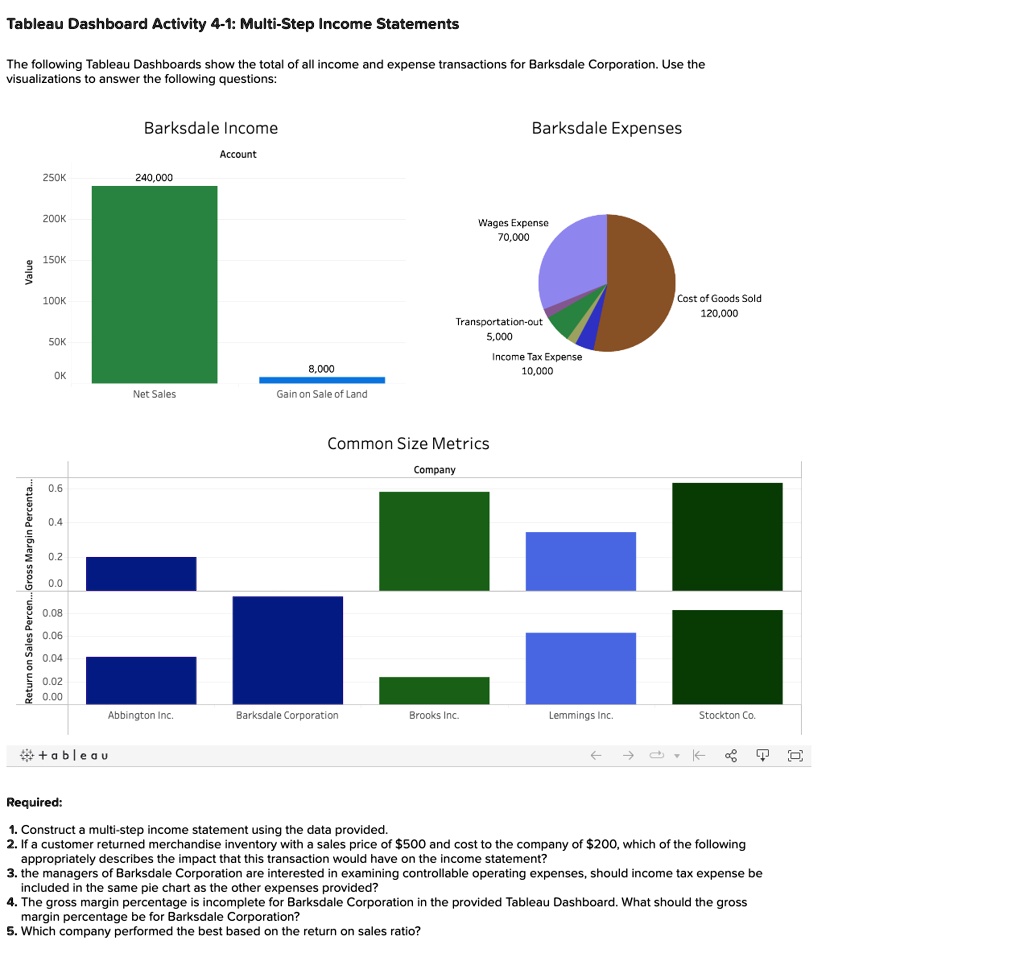
The following Tableau Dashboards show the total of all income and expense transactions for Barksdale Corporation. Use the
visualizations to answer the following questions:
Barksdale Income
Barksdale Expenses
Value
0.6
0.4
250K
240,000
200K
150K
100K
50K
Account
8,000
OK
Net Sales
Gain on Sale of Land
Wages Expense
70,000
Transportation-out
5,000
Income Tax Expense
10,000
Common Size Metrics
Company
Cost of Goods Sold
120,000
0.2
0.0
0.08
0.06
0.04
0.02
0.00
Abbington Inc.
Barksdale Corporation
Brooks Inc.
Lemmings Inc.
Stockton Co.
+ableau
?
Required:
1. Construct a multi-step income statement using the data provided.
2. If a customer returned merchandise inventory with a sales price of $500 and cost to the company of $200, which of the following
appropriately describes the impact that this transaction would have on the income statement?
3. the managers of Barksdale Corporation are interested in examining controllable operating expenses, should income tax expense be
included in the same pie chart as the other expenses provided?
4. The gross margin percentage is incomplete for Barksdale Corporation in the provided Tableau Dashboard. What should the gross
margin percentage be for Barksdale Corporation?
5. Which company performed the best based on the return on sales ratio?