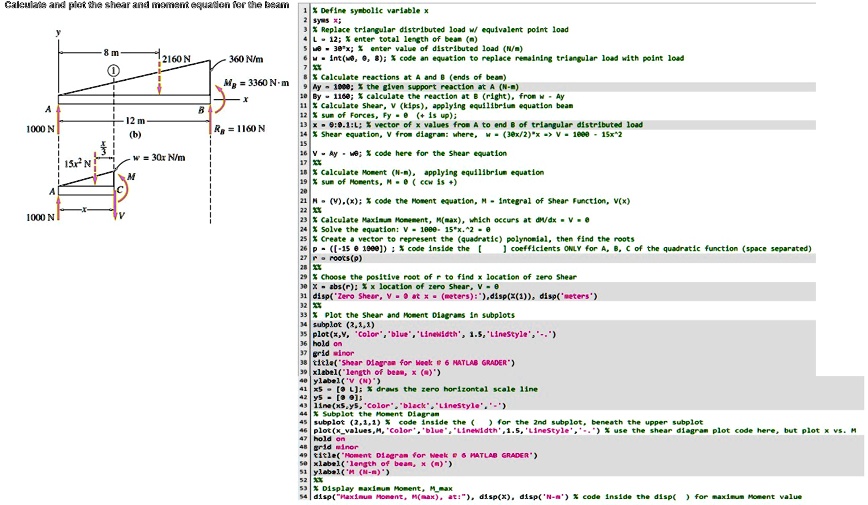
Calculate and plot the shear and moment equation for the beam. Please use the MATLAB Coding template. I'm on my last attempt and the code is telling me Line 21 is incorrect. It would be a great help if you could show me the correct code.
Calculate and plot the beam.
Define symbolic variable x: syms x;
Replace triangular distributed load with equivalent point load: L = 12; % enter total length of beam (m) xfxeE = 2160 N 360 N/m 7 x%
Calculate reactions at A and B ends of beam: Mfg = 3360 N-m Ay = 180eX the given support reaction at A N-m By = -1160;X calculate the reaction at B right, from w -Ay 11 calculate ShearV kips, applying equilibrium equation beam 64 2|x sum of Forces, Fy-+1s up I2 m Rg = 1160 N x = 9.1:LX vector of x values from A to end B of triangular distributed load (b) x Shear equationV from diagram: where, w = 3ex/2*x => V = 1eee-15x^2 15 v Aywe;X code here for the Shear equation = 3Qr N/m 17 X Calculate Moment N-m applying equilibrium equation 19 x sum of Moments, M-ccw ss+ Vx code the Moment equation M-integral of Shear Function V(x 22 23 x Calculate Maximum Moment, M(max, which occurs at dM/dx=V=e 24 x Solve the equation V-100-15*x.^2-e X Create a vector to represent the quadratic polynomial, then find the roots 26 p[-15e1900];X code inside the [ ] coefficients ONLY for A, B, C of the quadratic function space separated 2 roots) 28 xx 25x Choose the positive root of r to find x location of zero Shear 30 X-zbsr:Xx location of zero Shear, V-e 31 disp Zero Shear, V=9 at x=meters), disp X1, disp's meters) 1000N 15xN 1000N 33 x Plot the Shear and Moment Diagrams in subplots subplot 2.1,1) 35 plot x, v, Color, 'blue,' Linewidth, 1.5, "LineStyle', ".) 36 hold on 37 grid minor 38 Shear Diagram for Week 6 MATLAB GRADER 39 x label length of beam, x (m) 40 x 5 e [a L] X draws the zero horizontal scale line a y 5 - [9]; 41 in x s, ys color black LineStyle, 44 X Subplot the Moment Diagram 45 subplot 2,a,a X code inside the for the 2nd subplot, beneath the upper subplot plot x_values, M, Color, blue Linewidth, 1.5, 'LineStyle.)x use the shear diagram plot code here, but plot x vs. 47 hold on 48 grid minor ile Moment Diagram For Week 6 MATLAB GRADER') 50 x label length of beam, x (m) 51 Display maximum Moment, M_max inside the disp( aent value