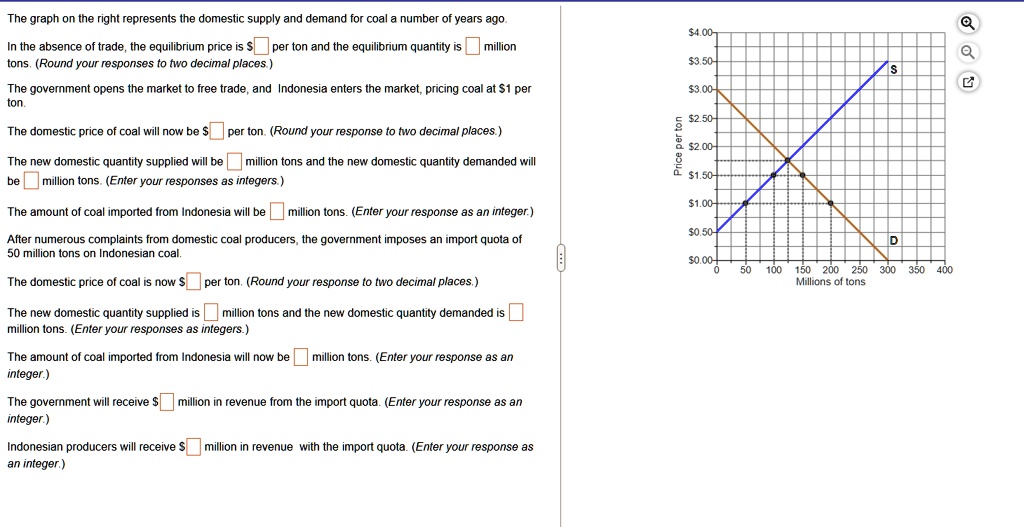
The graph on the right represents the domestic supply and demand for coal a number of years ago.
In the absence of trade, the equilibrium price is $1.75 per ton and the equilibrium quantity is 150 million
tons. (Round your responses to two decimal places.)
The government opens the market to free trade, and Indonesia enters the market, pricing coal at $1 per
ton.
The domestic price of coal will now be $1.00 per ton. (Round your response to two decimal places.)
The new domestic quantity supplied will be 50 million tons and the new domestic quantity demanded will
be 200 million tons. (Enter your responses as integers.)
The amount of coal imported from Indonesia will be 150 million tons. (Enter your response as an integer.)
After numerous complaints from domestic coal producers, the government imposes an import quota of
50 million tons on Indonesian coal.
The domestic price of coal is now $1.50 per ton. (Round your response to two decimal places.)
The new domestic quantity supplied is 100 million tons and the new domestic quantity demanded is
150 million tons. (Enter your responses as integers.)
The amount of coal imported from Indonesia will now be 50 million tons. (Enter your response as an
integer.)
The government will receive $25 million in revenue from the import quota. (Enter your response as an
integer.)
Indonesian producers will receive $75 million in revenue with the import quota. (Enter your response as
an integer.)
Price per ton
$4.00-
$3.50-
$3.00-
$2.50-
$2.00-
$1.50-
$1.00-
$0.50
$0.00-
D
S
50 100 150 200 250 300 350 400
Millions of tons
Q
Q