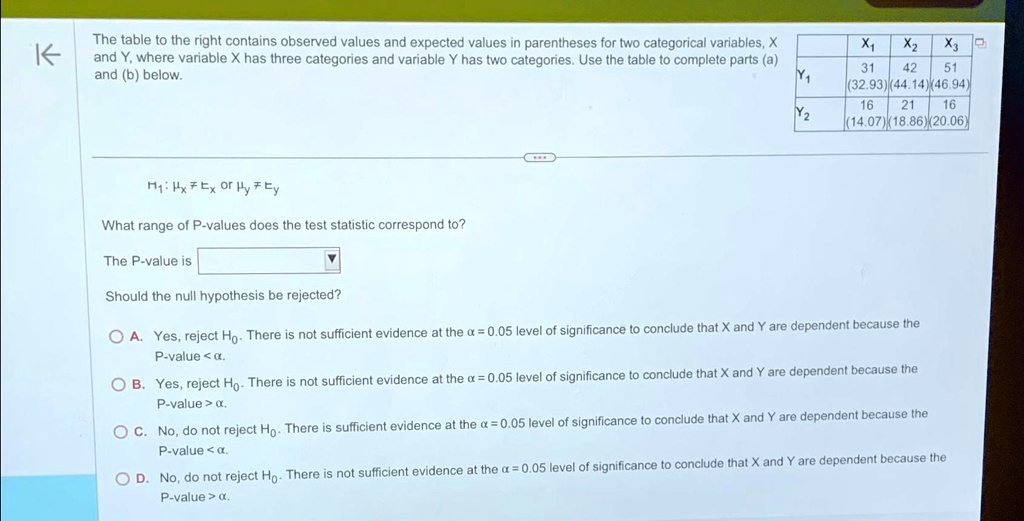
The table to the right contains observed values and expected values in parentheses for two categorical variables, x and Y, where variable x has three categories and variable Y has two categories. Use the table to complete parts (a) and (b) below.
able[[,x_(1),x_(2),x_(3)
The table to the right contains observed values and expected values in parentheses for two categorical variables, X and Y, where variable X has three categories and variable Y has two categories. Use the table to complete parts (a) and (b) below.
X1 X2 X3
31 42 51
(32.93) (44.14) (46.94)
16 21 16
(14.07) (18.86) (20.06)
Y1 Y2
H1 FEor yFEy
What range of P-values does the test statistic correspond to?
The P-value is
Should the null hypothesis be rejected?
O A. Yes, reject Ho. There is not sufficient evidence at the = 0.05 level of significance to conclude that X and Y are dependent because the P-value <.
O B. Yes, reject Ho. There is not sufficient evidence at the = 0.05 level of significance to conclude that X and Y are dependent because the P-value >
O C. No, do not reject Ho. There is sufficient evidence at the = 0.05 level of significance to conclude that X and Y are dependent because the P-value <
O D. No, do not reject Ho. There is not sufficient evidence at the = 0.05 level of significance to conclude that X and Y are dependent because the P-value >.