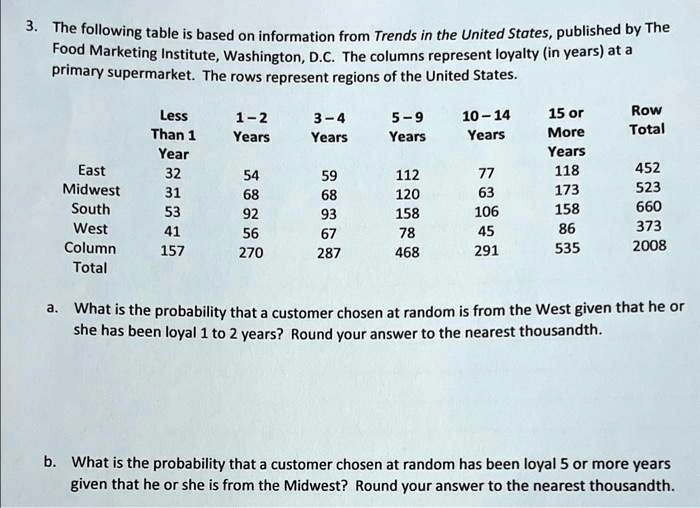
3. The following table is based on information from Trends in the United States, published by The
Food Marketing Institute, Washington, D.C. The columns represent loyalty (in years) at a
primary supermarket. The rows represent regions of the United States.
Less
1 - 2
3 - 4
5 - 9
10 - 14
15 or
Row
Than 1
Years
Years
Years
Years
More
Total
Year
East
32
54
59
112
77
118
452
Midwest
31
68
68
120
63
173
523
South
53
92
93
158
106
158
660
West
41
56
67
78
45
86
373
Column
157
270
287
468
291
535
2008
Total
a. What is the probability that a customer chosen at random is from the West given that he or
she has been loyal 1 to 2 years? Round your answer to the nearest thousandth.
b. What is the probability that a customer chosen at random has been loyal 5 or more years
given that he or she is from the Midwest? Round your answer to the nearest thousandth.