6. Producer surplus and price changes
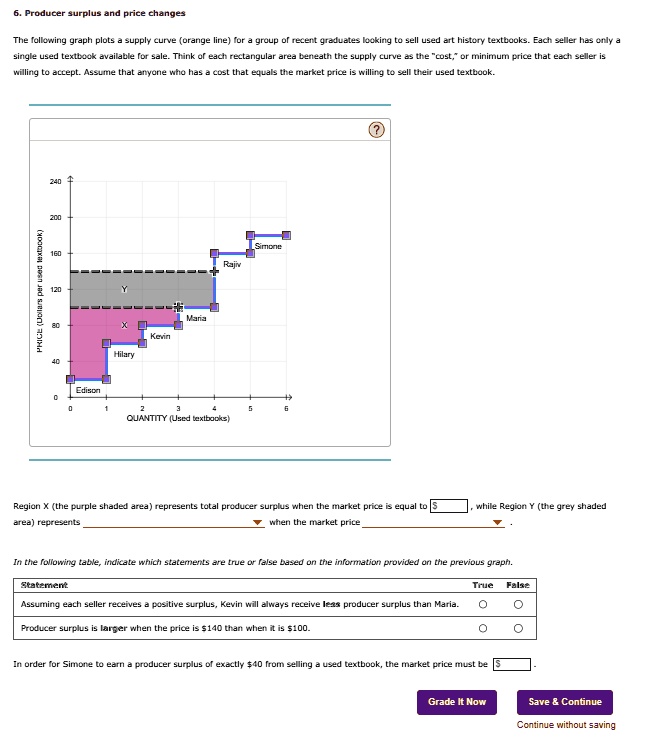
The following graph plots a supply curve (orange line) for a group of recent graduates looking to sell used art history textbooks. Each seller has only a
single used textbook available for sale. Think of each rectangular area beneath the supply curve as the "cost," or minimum price that each seller is
willing to accept. Assume that anyone who has a cost that equals the market price is willing to sell their used textbook.
PRICE (Dollars
per used
textbook)
240
200
160
120
Y
Maria
80
X
Kevin
Hilary
40
0
0
1
2
3
4
5
6
QUANTITY (Used textbooks)
Simone
Rajiv
Edison
?
Region X (the purple shaded area) represents total producer surplus when the market price is equal to $, while Region Y (the grey shaded
area) represents when the market price
In the following table, indicate which statements are true or false based on the information provided on the previous graph.
Statement True False
Assuming each seller receives a positive surplus, Kevin will always receive less producer surplus than Maria.
Producer surplus is larger when the price is $140 than when it is $100.
In order for Simone to earn a producer surplus of exactly $40 from selling a used textbook, the market price must be $
Grade It Now Save & Continue
Continue without saving