Applications of Integration
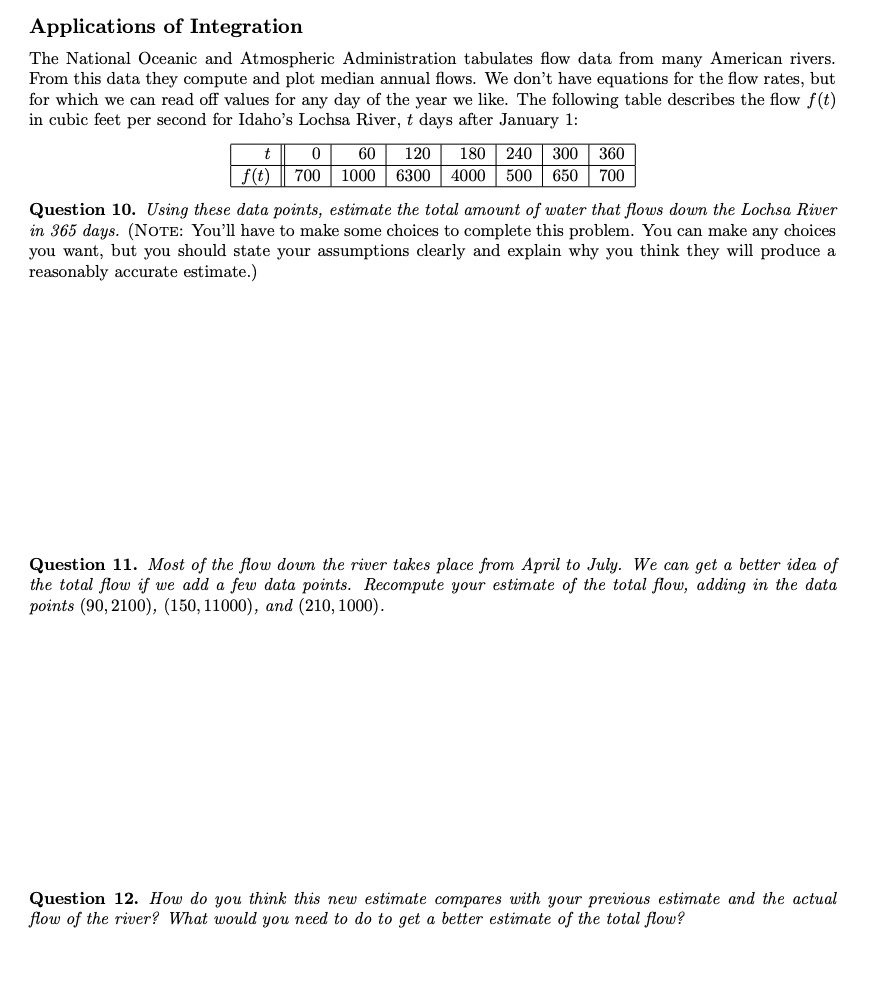
The National Oceanic and Atmospheric Administration tabulates flow data from many American rivers. From this data they compute and plot median annual flows. We don't have equations for the flow rates, but for which we can read off values for any day of the year we like. The following table describes the flow $f(t)$ in cubic feet per second for Idaho's Lochsa River, $t$ days after January 1:
t 0 60 120 180 240 300 360
f(t) 700 1000 6300 4000 500 650 700
Question 10. Using these data points, estimate the total amount of water that flows down the Lochsa River in 365 days. (NOTE: You'll have to make some choices to complete this problem. You can make any choices you want, but you should state your assumptions clearly and explain why you think they will produce a reasonably accurate estimate.)
Question 11. Most of the flow down the river takes place from April to July. We can get a better idea of the total flow if we add a few data points. Recompute your estimate of the total flow, adding in the data points (90, 2100), (150, 11000), and (210, 1000).
Question 12. How do you think this new estimate compares with your previous estimate and the actual flow of the river? What would you need to do to get a better estimate of the total flow?