(b) Suppose in period 1 there is an unexpected and permanent change in Korea's money supply. In particular, the Bank of Korea announces that it will decrease the supply of Korean won—the national currency—by 5%. In the same graphs you used for part (a), indicate any shifts in curves and show the equilibrium in the short run (period 1) for both countries.
(c) Which currency appreciates between period 0 and period 1, and by how much (i.e., more than 5%, less than 5%, or exactly 5%).
(d) Using the same graphs again, depict the long run (period 2 and onward) equilibrium in both countries, indicating any shifts in curves.
(e) Which currency appreciates between period 1 and period 2?
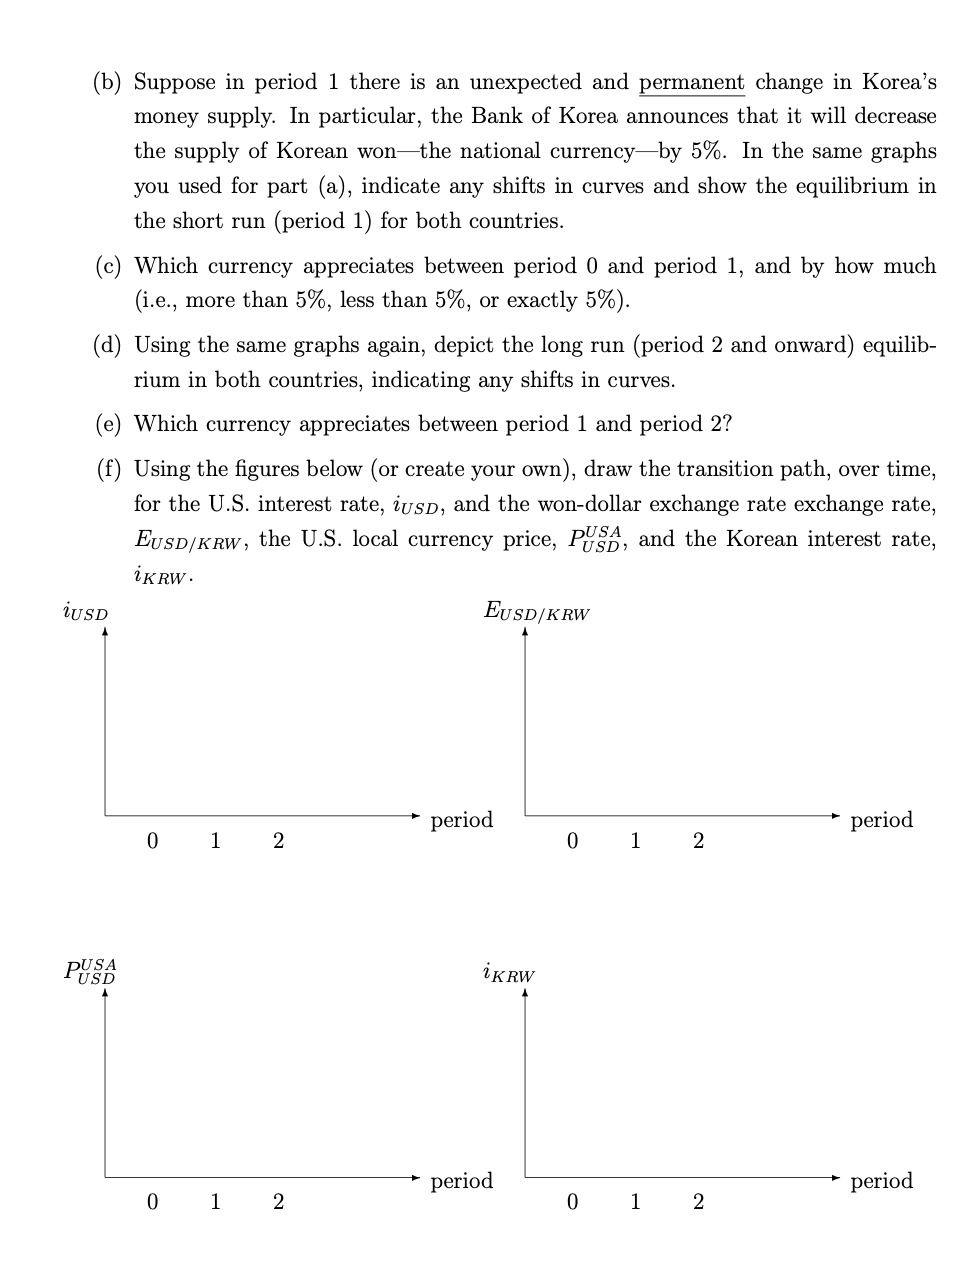
(f) Using the figures below (or create your own), draw the transition path, over time, for the U.S. interest rate, i_{USD}, and the won-dollar exchange rate exchange rate, E_{USD/KRW}, the U.S. local currency price, P_{USD}^{USA}, and the Korean interest rate, i_{KRW}.