Questions and Problems
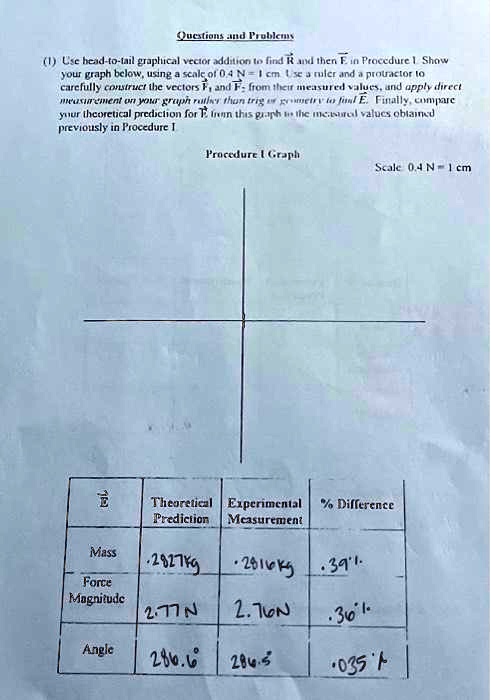
(1) Use head-to-tail graphical vector addition to find \(\vec{R}\) and then \(\vec{E}\) in Procedure 1. Show
your graph below, using a scale of 0.4 N = 1 cm. Use a ruler and a protractor to
carefully construct the vectors \(\vec{F_1}\) and \(\vec{F_2}\) from their measured values, and apply direct
measurement on your graph rather than trig or geometry to find \(\vec{E}\). Finally, compare
your theoretical prediction for \(\vec{R}\) from this graph to the measured values obtained
previously in Procedure 1
Procedure 1 Graph
Scale 0.4 N = 1 cm
\(\vec{E}\)
Theoretical
Experimental
% Difference
Prediction
Measurement
Mass
.2817kg
.2816kg
.39%
Force
Magnitude
2.77N
2.76N
.36%
Angle
286.6°
286.5°
.035%