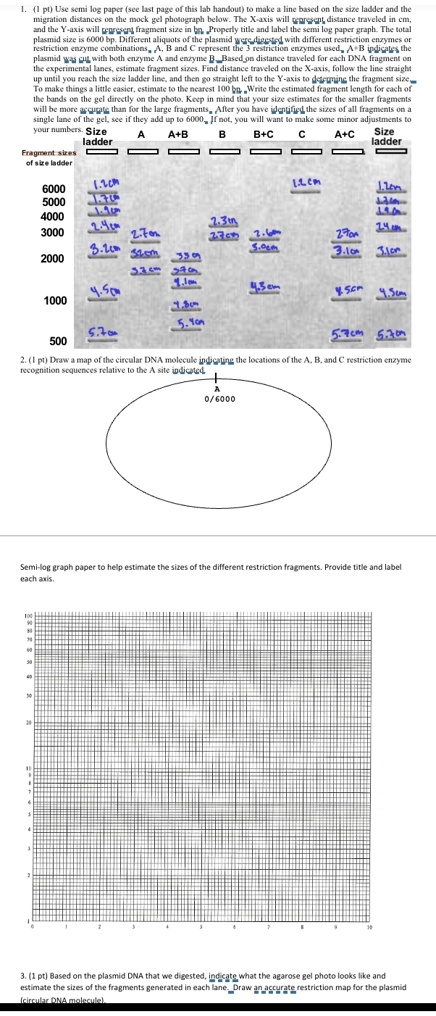
1. Use semi-log paper (see last page of this lab handout) to make a line based on the size ladder and the migration distances on the mock gel photograph below. The X-axis will represent distance traveled in cm, and the Y-axis will represent fragment size in bp. Properly title and label the semi-log paper graph. The total plasmid size is 6000 bp. Different aliquots of the plasmid were digested with different restriction enzymes or restriction enzyme combinations. A, B, and C represent the 3 restriction enzymes used. A+B indicates the plasmid was cut with both enzyme A and enzyme B. Based on distance traveled for each DNA fragment on the experimental lanes, estimate fragment sizes. Find distance traveled on the X-axis, follow the line straight up until you reach the size ladder line, and then go straight left to the Y-axis to determine the fragment size. To make things a little easier, estimate to the nearest 100 bp. Write the estimated fragment length for each of the bands on the gel directly on the photo. Keep in mind that your size estimates for the smaller fragments will be more accurate than for the large fragments. After you have identified the sizes of all fragments on a single lane of the gel, see if they add up to 6000. If not, you will want to make some minor adjustments to your numbers.
2. Draw a map of the circular DNA molecule indicating the locations of the A, B, and C restriction enzyme recognition sequences relative to the A site indicated. Use semi-log graph paper to help estimate the sizes of the different restriction fragments. Provide a title and label for each axis.
3. Based on the plasmid DNA that we digested, indicate what the agarose gel photo looks like and estimate the sizes of the fragments generated in each lane. Draw an accurate restriction map for the plasmid (circular DNA molecule).