Flaal Project
Fall 2023
Math 153 Statistics
Bettling Company Case Study
Imagine you are a manager at a major bottling company. Customers have begun to
complain that the bottles of the brand of soda produced in your company contain
less than the advertised sixteen (16) ounces of product. Your boss wants to solve
the problem at hand and has asked you to investigate. You have your employees
pull thirty (30) bottles off the line at random from all the shifts at the bottling plant.
You ask your employees to measure the amount of soda there is in each bottle.
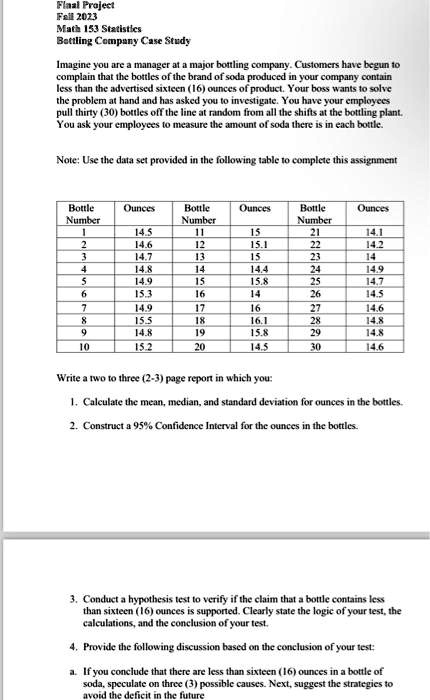
Note: Use the data set provided in the following table to complete this assignment
Bottle Ounces Bottle
Ounces
Number
Number
Bottle
Number
Ounces
1
14.5
11
15
21
14.1
2
14.6
12
15.1
22
14.2
3
14.7
13
15
23
14
4
14.8
14
14.4
24
14.9
5
14.9
15
15.8
25
14,7
6
15.3
16
14
26
14.5
7
14.9
17
16
27
14.6
8
15.5
18
16.1
28
14.8
9
14.8
19
15.8
29
14.8
10
15.2
20
14.5
30
14.6
Write a two to three (2-3) page report in which you:
1. Calculate the mean, median, and standard deviation for ounces in the bottles.
2. Construct a 95% Confidence Interval for the ounces in the bottles.
3. Conduct a hypothesis test to verify if the claim that a bottle contains less
than sixteen (16) ounces is supported. Clearly state the logic of your test, the
calculations, and the conclusion of your test.
4. Provide the following discussion based on the conclusion of your test:
a. If you conclude that there are less than sixteen (16) ounces in a bottle of
soda, speculate on three (3) possible causes. Next, suggest the strategies to
avoid the deficit in the future