Using the spectroscope scale
As mentioned is section 5.2a of About the
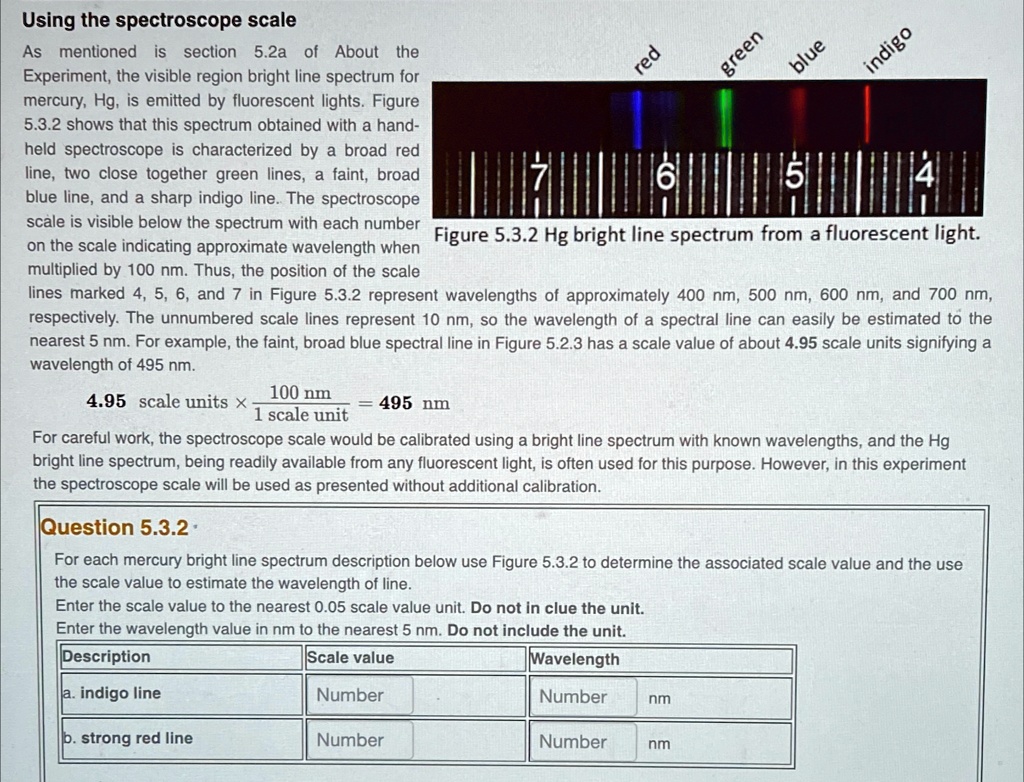
Experiment, the visible region bright line spectrum for
mercury, Hg, is emitted by fluorescent lights. Figure
5.3.2 shows that this spectrum obtained with a hand-
held spectroscope is characterized by a broad red
line, two close together green lines, a faint, broad
blue line, and a sharp indigo line. The spectroscope
scale is visible below the spectrum with each number
on the scale indicating approximate wavelength when
multiplied by 100 nm. Thus, the position of the scale
lines marked 4, 5, 6, and 7 in Figure 5.3.2 represent wavelengths of approximately 400 nm, 500 nm, 600 nm, and 700 nm,
respectively. The unnumbered scale lines represent 10 nm, so the wavelength of a spectral line can easily be estimated to the
nearest 5 nm. For example, the faint, broad blue spectral line in Figure 5.2.3 has a scale value of about 4.95 scale units signifying a
wavelength of 495 nm.
4.95 scale units \times \frac{100 \text{ nm}}{1 \text{ scale unit}} = 495 \text{ nm}
For careful work, the spectroscope scale would be calibrated using a bright line spectrum with known wavelengths, and the Hg
bright line spectrum, being readily available from any fluorescent light, is often used for this purpose. However, in this experiment
the spectroscope scale will be used as presented without additional calibration.
Question 5.3.2
For each mercury bright line spectrum description below use Figure 5.3.2 to determine the associated scale value and the use
the scale value to estimate the wavelength of line.
Enter the scale value to the nearest 0.05 scale value unit. Do not in clue the unit.
Enter the wavelength value in nm to the nearest 5 nm. Do not include the unit.
Description Scale value Wavelength
a. indigo line Number Number nm
b. strong red line Number Number nm