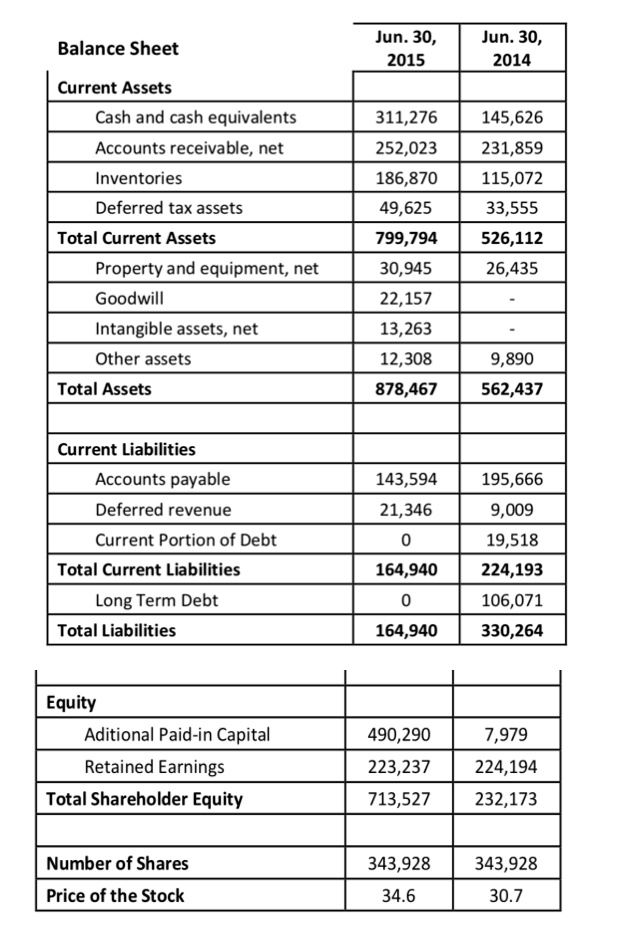
Calculate for the given years: The operating cycle and Net Operating Cycle
Compare and explain why the ratios have changed over the year
Jun. 30, 2015
Jun. 30, 2014
Balance Sheet
Current Assets
Cash and cash equivalents
311,276
252,023
Accounts receivable, net
145,626
231,859
Inventories
186,870
115,072
Deferred tax assets
49,625
33,555
Total Current Assets
693,397
632,509
Property and equipment, net
30,945
26,435
Goodwill
22,157
13,263
Intangible assets, net
12,308
9,890
Other assets
9,890
9,890
Total Assets
758,697
692,987
Current Liabilities
Accounts payable
143,594
195,666
Deferred revenue
21,346
0
Current Portion of Debt
19,518
224,193
Total Current Liabilities
184,458
419,859
Long Term Debt
0
106,071
Total Liabilities
184,458
525,930
Equity
Additional Paid-in Capital
490,290
490,290
Retained Earnings
7,979
224,194
Total Shareholder Equity
498,269
714,484
Number of Shares
343,928
343,928
Price of the Stock
34.6
30.7