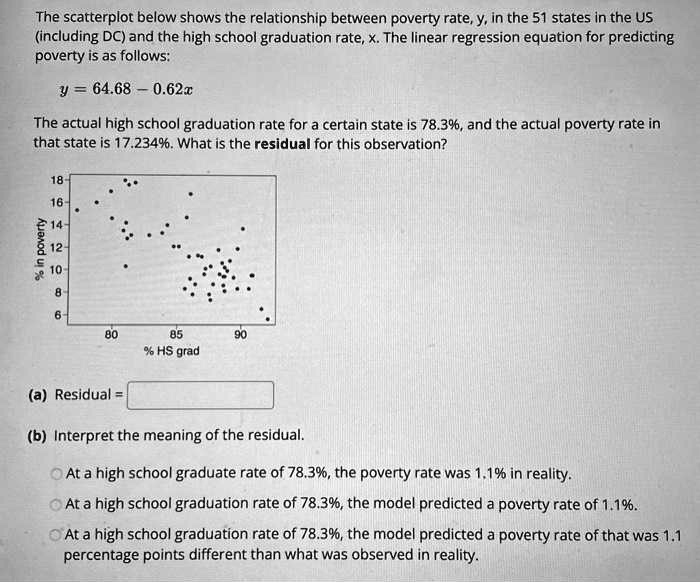
The scatterplot below shows the relationship between poverty rate, y, in the 51 states in the US (including DC) and the high school graduation rate, x. The linear regression equation for predicting poverty is as follows:
y = 64.68 - 0.62x
The actual high school graduation rate for a certain state is 78.3%, and the actual poverty rate in that state is 17.234%. What is the residual for this observation?
(a) Residual =
(b) Interpret the meaning of the residual.
At a high school graduate rate of 78.3%, the poverty rate was 1.1% in reality.
At a high school graduation rate of 78.3%, the model predicted a poverty rate of 1.1%.
At a high school graduation rate of 78.3%, the model predicted a poverty rate of that was 1.1 percentage points different than what was observed in reality.