3) Develop a Matlab function to compute the velocity v of a particular projectile as
a function of time t. In this problem, the velocity profile is described by a
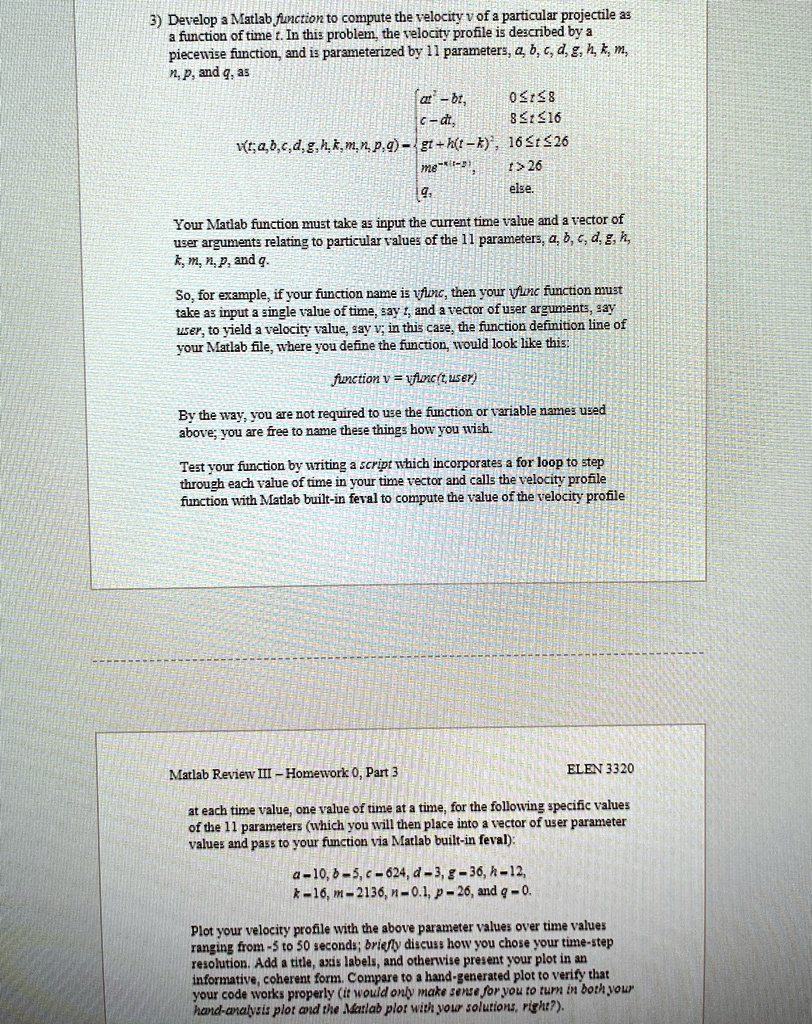
piecewise function, and is parameterized by 11 parameters, a, b, c, d, g, h, k, m,
n, p, and q, as
$$
v(t; a,b,c,d,g,h,k,m,n,p,q) = \begin{cases}
at-bt, & 0 \le t \le 8 \\
c-dt, & 8 \le t \le 16 \\
g+h(t-k), & 16 \le t \le 26 \\
m, & t > 26 \\
\end{cases}
$$
Your Matlab function must take as input the current time value and a vector of
user arguments relating to particular values of the 11 parameters, a, b, c, d, g, h,
k, m, n, p, and q.
So, for example, if your function name is vfunc, then your vfunc function must
take as input a single value of time, say t, and a vector of user arguments, say
user, to yield a velocity value, say v; in this case, the function definition line of
your Matlab file, where you define the function, would look like this:
function v = vfunc(t, user)
By the way, you are not required to use the function or variable names used
above; you are free to name these things how you wish.
Test your function by writing a script which incorporates a for loop to step
through each value of time in your time vector and calls the velocity profile
function with Matlab built-in feval to compute the value of the velocity profile
Matlab Review III - Homework 0, Part 3
ELEN 3320
at each time value, one value of time at a time, for the following specific values
of the 11 parameters (which you will then place into a vector of user parameter
values and pass to your function via Matlab built-in feval):
a = -10, b = -5, c = -624, d = -3, g = 36, h = -12,
k = -16, m = -2136, n = 0.1, p = 26, and q = 0.
Plot your velocity profile with the above parameter values over time values
ranging from -5 to 50 seconds; briefly discuss how you chose your time-step
resolution. Add a title, axis labels, and otherwise present your plot in an
informative, coherent form. Compare to a hand-generated plot to verify that
your code works properly (it would only make sense for you to turn in both your
hand-analysis plot and the Matlab plot with your solutions, right?).