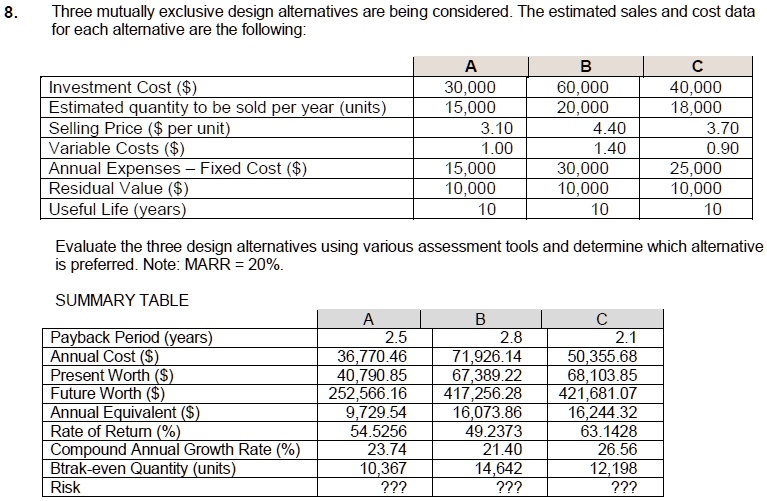
Three mutually exclusive design alternatives are being considered. The estimated sales and cost data for each alternative are as follows:
Alternative A:
Investment Cost: $30,000
Estimated quantity to be sold per year: 15,000 units
Selling Price (per unit): $3.10
Variable Costs: $1.00
Annual Expenses - Fixed Cost: $15,000
Residual Value: $10,000
Useful Life: 10 years
Alternative B:
Investment Cost: $40,000
Estimated quantity to be sold per year: 18,000 units
Selling Price (per unit): $3.70
Variable Costs: $0.90
Annual Expenses - Fixed Cost: $25,000
Residual Value: $10,000
Useful Life: 10 years
Alternative C:
Investment Cost: $60,000
Estimated quantity to be sold per year: 20,000 units
Selling Price (per unit): $4.40
Variable Costs: $1.40
Annual Expenses - Fixed Cost: $30,000
Residual Value: $10,000
Useful Life: 10 years
Evaluate the three design alternatives using various assessment tools and determine which alternative is preferred. Note: MARR (Minimum Acceptable Rate of Return) is 20%.
SUMMARY TABLE
Alternative A:
Payback Period (years): 2.5
Annual Cost ($): 36,770.46
Present Worth ($): 40,790.85
Future Worth ($): 252,566.16
Annual Equivalent (S): 9,729.54
Rate of Return (%): 54.5256
Compound Annual Growth Rate (%): 23.74
Break-even Quantity (units): 10,367
Alternative B:
Payback Period (years): 2.8
Annual Cost ($): 71,926.14
Present Worth ($): 67,389.22
Future Worth ($): 417,256.28
Annual Equivalent (S): 16,073.86
Rate of Return (%): 49.2373
Compound Annual Growth Rate (%): 21.40
Break-even Quantity (units): 14,642
Alternative C:
Payback Period (years): 2.1
Annual Cost ($): 50,355.68
Present Worth ($): 68,103.85
Future Worth ($): 421,681.07
Annual Equivalent (S): 16,244.32
Rate of Return (%): 63.1428
Compound Annual Growth Rate (%): 26.56
Break-even Quantity (units): 12,198