Ace - AI Tutor
Ask Our Educators
Textbooks
My Library
Flashcards
Scribe - AI Notes
Notes & Exams
Download App
christopher hall

christopher h.

Divider

Questions asked

BEST MATCH

Required information [The following information applies to the questions displayed below.] Diego Company manufactures one product that is sold for $73 per unit in two geographic regions-East and West. The following information pertains to the company's first year of operations in which it produced 44,000 units and sold 39,000 units. Variable costs per unit: Manufacturing: Direct materials $ 23 Direct labor $ 16 Variable manufacturing overhead $ 2 Variable selling and administrative $ 4 Fixed costs per year: Fixed manufacturing overhead $ 748,000 Fixed selling and administrative expense $ 400,000 The company sold 29,000 units in the East region and 10,000 units in the West region. It determined $180,000 of its fixed selling and administrative expense is traceable to the West region, $130,000 is traceable to the East region, and the remaining $90,000 is a common fixed expense. The company will continue to incur the total amount of its fixed manufacturing overhead costs as long as it continues to produce any amount of its only product. 2. What is the unit product cost under absorption costing? Unit product cost

View Answer
divider
BEST MATCH

n Exercises 23–36, find the limit of the transcendental function. 23. lim x→π2 sin x

View Answer
divider
BEST MATCH

The Calvin cycle uses _____, which are products of the light reactions of photosynthesis. Multiple Choice ADP and NADH CO2 and H2O RuBP and O2 3-phosphoglycerate and glucose ATP and NADPH

View Answer
divider
BEST MATCH

The high-pass RL filter shown below has the R and L1 values noted. Vin R L1 R = 3.9 k$\Omega$ L1 = 3.3 mH Calculate the -3dB frequency, $f_c$. Answer: OkHz OHz Vout

View Answer
divider
BEST MATCH

does the CAP protein change shape in the course of its function?

View Answer
divider
BEST MATCH

Problem 3 (10 points). The following table shows a test result of a classifier on a dataset. Tuple_id Actual Class Probability 1 P 0.75 2 N 0.32 3 N 0.87 4 P 0.93 5 P 0.84 6 P 0.48 7 N 0.95 8 P 0.59 9 N 0.63 10 P 0.74 (1). For each row, compute TP, FP, TN, FN, TPR, and FPR. (2). Plot the ROC curve for the dataset. You must draw the curve yourself (i.e., don't use R or any other software to generate the curve).

View Answer
divider
BEST MATCH

All the assumptions you made, • All the omissions/inconsistencies you have discovered in the provided specification. • Group member responsibilities, group meetings. 4.4 Detailed specification of INDIVIDUAL task As the individual task you are asked to produce a number of analysis and design specifications of a particular part of the system. Each group member should select ONE of the following 'functions' for their individual task and clearly specify their name and their chosen functions clearly. 1. Make Payment. 2. Purchase Plant. 3. Report Preparation. 4. Join the program. 5. Take Certification Exam After selecting a function create the design specifications of the system as mentioned below: Environmental model specification • Context Level Internal model specification for the system • The Level 1 DFD fragments • Level 2 DFDs for the particular function Design specification • Structure chart for the particular function. • Module specifications (MSpecs) for corresponding modules Please note that a template for MSpecs is given below under Footnotes.

View Answer
divider
BEST MATCH

Texts: Description: The sensor used in this robot is designed to detect the line that the robot is following. It is comprised of a pair of Light Emitting Diodes (LED1 and LED2) and a pair of photoresistors (R13 and R14). The amount of light reflected from a white surface will be significantly more than the light reflected by a black line. The 'sensor' subsystem in this case will provide information about which of the photoresistor pairs is over the line, and the control system will drive the vehicle such that it will turn to keep itself on the line. This step will be to emulate the control system. As we discovered above, the hardware controller on our line-following robot implements a simple bang-bang controller. The objective of this controller is to keep the robot driving along the line. If the left sensor hits the line, the left motor will be turned off, and the robot will tend to turn left. If the right sensor hits the line, the right motor will be turned off, and the robot will tend to turn right. If neither sensor is on the line, both motors will turn on, and the robot will tend to move straight. a. On Python, implement a function, ControlModel, which takes the signed distance of the vehicle's sensors, (dl, dr), and determines the desired wheel speeds, vl and vr, based on whether the left and right sensors are inside (left) or outside (right) of the ellipse. b. Assuming that the robot starts at the origin (0, 0) and heading of 0 radians (i.e. facing along the x-axis), create a loop (or a spreadsheet if using Excel) that drives the robot along a path described by the ellipse we considered above (major axis a=12.5cm, b=7.5cm, thickness 1.5cm, and centered on the point (0, 7.5cm)). The robot should be on this line when it starts at the origin. Use a timestep of 0.01s to drive the vehicle model through approximately one minute of travel. Appendix A includes some pseudocode that should give you an idea of how you might structure your code. Experiment with how long it takes the robot to achieve two full revolutions around the circuit. Plot the resulting vehicle path on an (x, y) plot for which each point you plot should represent the vehicle's position at each timestep. You should also plot the vehicle heading as a function of time, or you may wish to combine these plots to show the full pose of the vehicle throughout its circuit. Does the robot achieve the desired elliptical path? Provide a brief description of the path of the robot and consider how the controller behavior could be improved. c. As described at the outset, we wanted to develop our simulator so we could experiment with different controller designs. Our function, F(x, y), above tells us not only whether we are inside or outside of the ellipse but also how far inside or outside the ellipse we are. Rather than a bang-bang controller which turns the motors on or off, we can make the speed of the motors proportional to the distance from the ellipse. Implement a new controller, ControlModelProportional, which calculates the desired wheel speeds for the left and right wheels that are proportional to the distance that the left and right sensors are from the line. It should be possible to make a much smoother controller using this approach. Experiment with different values of the proportional parameter until you find a controller that exhibits smooth behavior. Prepare a report outlining the development of your simulator and addressing each of the points above. Consider how you can best illustrate the behavior of your robot. Include figures to illustrate the output of the functions you have written and to show how effectively the robot follows the line. 
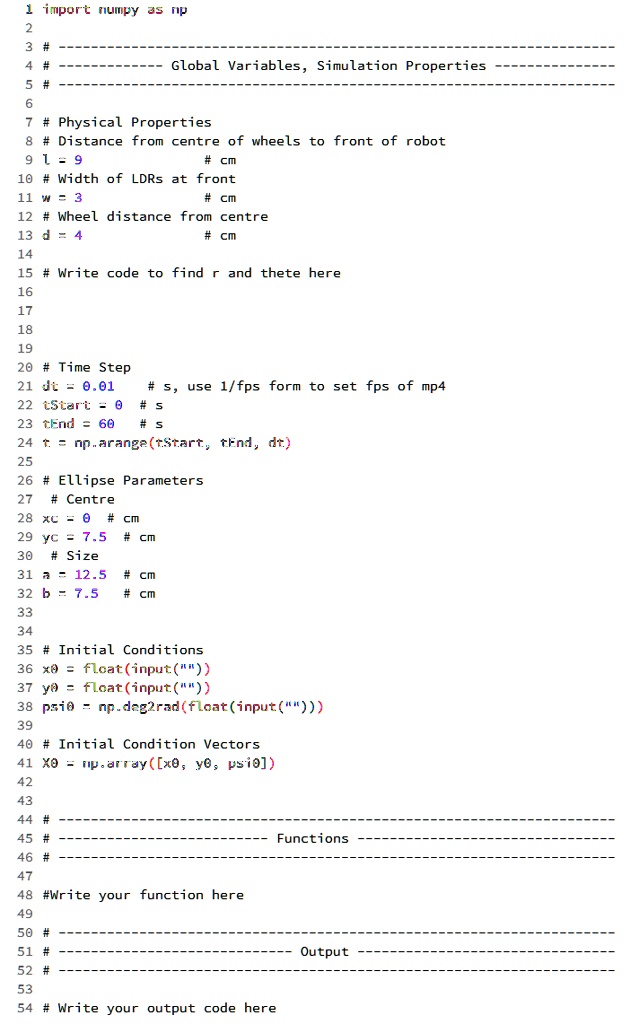
Please work on Python, and the ellipse is provided in the image. 1 import numpy as np 2 3 # Global Variables, Simulation Properties 4 5 # Physical Properties 6 # Distance from center of wheels to front of robot 7 l = 9 # cm 8 # Width of LDRs at front 9 w = 3 # cm 10 # Wheel distance from center 11 d = 4 # cm 12 13 # Write code to find r and theta here 14 15 16 17 18 19 # Time Step 20 dt = 0.01 # s, use 1/fps form to set fps of mp4 21 tStart = 0 # s 22 tEnd = 60 # s 23 t = np.arange(tStart, tEnd, dt) 24 25 # Ellipse Parameters 26 # Center 27 xc = 0 # cm 28 yc = 7.5 # cm 29 # Size 30 a = 12.5 # cm 31 b = 7.5 # cm 32 33 34 # Initial Conditions 35 x = float(input()) 36 y = float(input()) 37 psi = np.deg2rad(float(input())) 38 39 # Initial Condition Vectors 40 xo = np.array([x, y, psi]) 41 42 43 44 # Functions 45 46 47 # Write your function here 48 49 50 51 # Output 52 53 # Write your output code here

View Answer
divider
BEST MATCH

Estimate for the Mean Sales Invoice Amount Data Sample Standard Deviation 61240.4208 =STDEV.S(D:D) Sample Mean 141853.44 =AVERAGE(D:D) Sample Size 100 =COUNT(D:D) Confidence Level 95% Intermediate Calculations Standard Error of the Mean 6124.0421 Degrees of Freedom 99 t Value 1.9842 Interval Half Width 12151.4281 Confidence Interval Interval Lower Limit 129702.01 Interval Upper Limit 154004.87 Question 2: Estimate the mean milk production for all farms A). Construct the 95\% confidence interval estimate for the mean milk production for all farms and provide your interpretation. Answer 2a: Please see unknown sig to the left. B). What assumptions must you make about the population distribution in order to construct the confidence interval estimate in (a)? C). Test a claim at 5\% significance level that the true mean milk production is at least 120K.

View Answer
divider
BEST MATCH

QUESTION 13 Blocking access to a service by overloading an intermediate network or network device is example of Compromise the integrity 1. 2. 3. 4. Compromise the authenticity Compromise the confidentiality Compromise the Availability QUESTION 14

View Answer
divider