A survey asked 106 shoppers about the meaning of the label "Made in the USA". Suppose a consumer advocate group claims that half of all consumers believe that it means "100%" of labor and materials are produced in the United States, one-fourth—"75 to 99%", one-fifth—"50 to 74%", and 5 percent—"less than 50%". The shopper's meanings about the amount of material in such product made in USA are shown in the accompanying table. Determine if the shoppers surveyed are statistically representative of the consumer advocate group claim.
Give the null and alternative hypotheses for testing the consumer advocate group's claim. Choose
A. $H_0$: $p_1 = 0.5$, $p_2 = 0.25$, $p_3 = 0.20$, $p_4 = 0.05$
$H_a$: At least one $p_i$ differs from its hypothesized value
B. $H_0$: $p_1 = 64$, $p_2 = 23$, $p_3 = 17$, $p_4 = 2$
$H_a$: At least one $p_i$ differs from its hypothesized value
C. $H_0$: $p_1 = 0.99$, $p_2 = 0.75$, $p_3 = 0.74$, $p_4 = 0.5$
$H_a$: At least one $p_i$ differs from its hypothesized value
Compute the test statistic for testing the hypotheses.
$\chi^2 = \text{____}$ (Round to three decimal places as needed.)
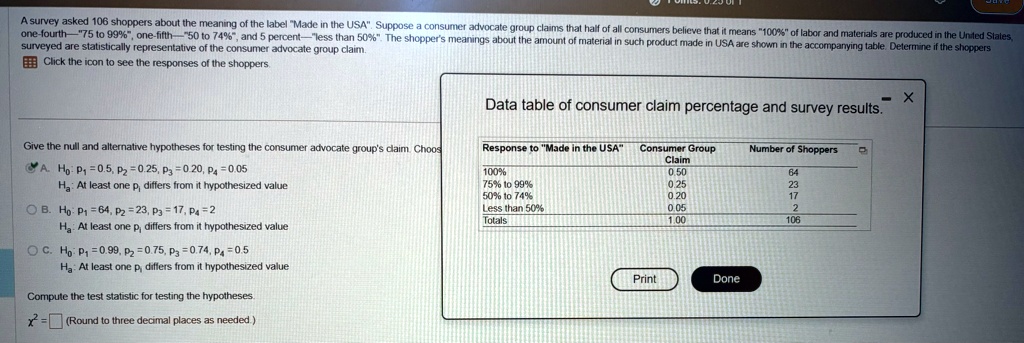
Data table of consumer claim percentage and survey results.
Response to "Made in the USA" | Consumer Group Claim | Number of Shoppers
---|---|---
100% | 0.50 | 64
75% to 99% | 0.25 | 23
50% to 74% | 0.20 | 17
Less than 50% | 0.05 | 2
Totals | 1.00 | 106