Ace - AI Tutor
Ask Our Educators
Textbooks
My Library
Flashcards
Scribe - AI Notes
Notes & Exams
Download App
cindy miller

cindy m.

Divider

Questions asked

BEST MATCH

have precise target gene modification 7. Double fertilization in angiosperms produces a 2N embryo and a 3N endosperm? What is the role of the endosperm? (2 POINT)

View Answer
divider
BEST MATCH

Which series of studies is perhaps the single most famous set of studies in the history of management and helped set the stage for the development of the Humanist school? Origin of the Species Hawthorne Studies The Mothman Studies Module 4

View Answer
divider
BEST MATCH

The three different eukaryotic RNA polymerases perform different functions and can be distinguished experimentally by their sensitivity to the toxin \(\alpha\)-amanitin. Match the appropriate function and \(\alpha\)-amanitin sensitivity to each RNA polymerase. RNA polymerase I RNA polymerase II RNA polymerase III Answer Bank inhibited by high concentrations of \(\alpha\)-amanitin synthesizes mostly pre-ribosomal RNA not inhibited by \(\alpha\)-amanitin synthesizes mostly pre-messenger RNA synthesizes primarily tRNA and small RNAs inhibited by low concentrations of \(\alpha\)-amanitin

View Answer
divider
BEST MATCH

a client who has moderatelly severe cognitive decline lives at home with a spouse as the primary caregiver. the client and spouse want to age in place for as long as possible but the caregiver reports a high level of stress. additionally the spouse reports that assisting the client with showering is them most difficult task of the day. what initial action should the otr take based on these findings

View Answer
divider
BEST MATCH

Harry’s Hoagies is completing the end of year closing process. What journal entry will Harry’s Hoagies make to close the Accounts Receivable account? Group of answer choices Debit Accounts Receivable, Credit Retained Earnings Debit Accounts Receivable, Credit Income Summary Debit Retained Earnings, Credit Accounts Receivable No closing journal entry is required

View Answer
divider
BEST MATCH

Exercises: Suppose we wish to study three different teaching methods used for a course. We measure student test scores and course satisfaction scores for each of the teaching methods. The teaching method is the independent variable and the measured scores are the dependent variables. We wish to determine whether the mean test and satisfaction scores differ among the three teaching methods. The data is shown below and can be found in the Course_Data.csv file. 
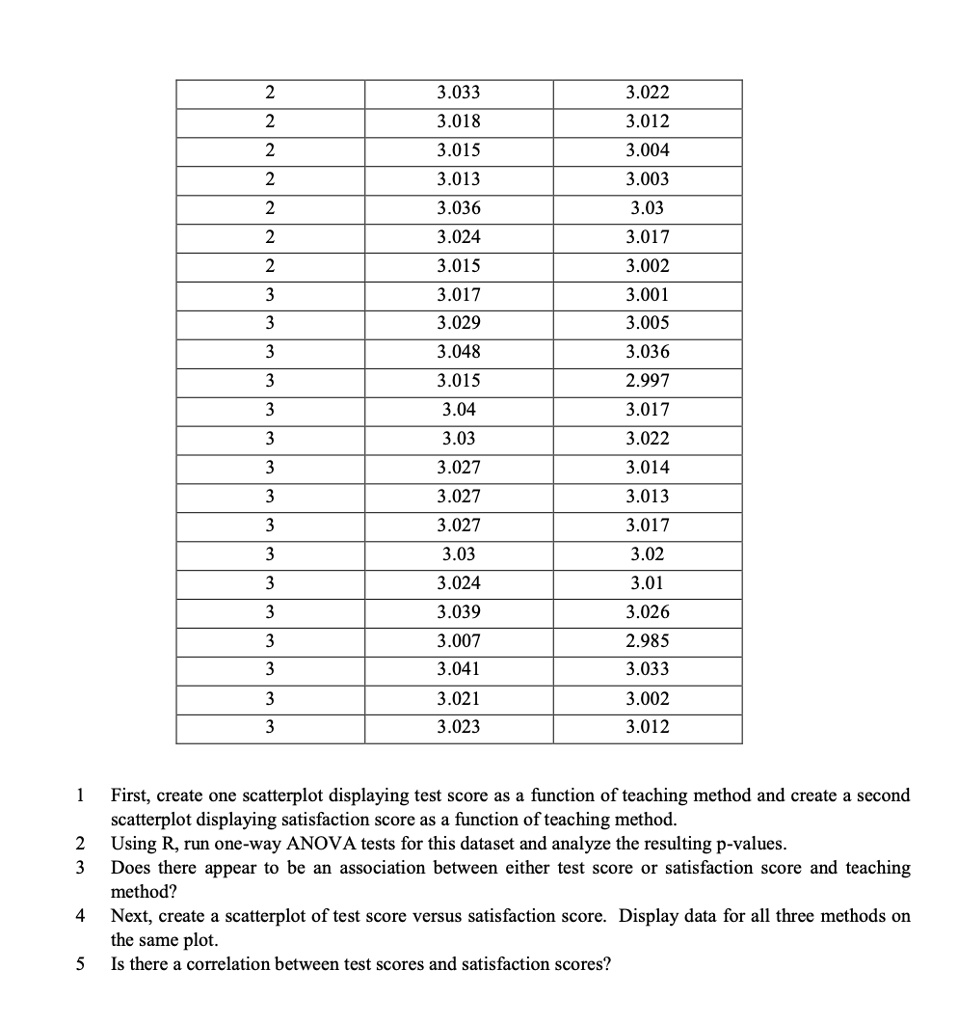
able[[Teaching Method,Test Score,Satisfaction Score],[1,3,3.001],[1,2.99,2.994],[1,3.041,3.032],[1,3.063,3.059],[1,3.035,3.026],[1,3.009,3.003],[1,3.032,3.025],[1,3.026,3.024],[1,3.039,3.03],[1,3.015,3.011],[1,3.018,3.008],[1,3.008,3.003],[1,3.012,3.007],[1,3,3.01],[1,3.003,2.997],[1,3.018,3.012],[2,3.05,3.045],[2,3.008,3.003],[2,2.997,2.993],[2,3.014,3.007],[2,3.009,3.006],[2,3.01,3],[2,3,2.993],[2,3.044,3.035],[2,3.041,3.041]] able[[2,3.033,3.022],[2,3.018,3.012],[2,3.015,3.004],[2,3.013,3.003],[2,3.036,3.03],[2,3.024,3.017],[2,3.015,3.002],[3,3.017,3.001],[3,3.029,3.005],[3,3.048,3.036],[3,3.015,2.997],[3,3.04,3.017],[3,3.03,3.022],[3,3.027,3.014],[3,3.027,3.013],[3,3.027,3.017],[3,3.03,3.02],[3,3.024,3.01],[3,3.039,3.026],[3,3.007,2.985],[3,3.041,3.033],[3,3.021,3.002],[3,3.023,3.012],[,,],[,,],[,3.027,],[,,]] 1 First, create one scatterplot displaying test score as a function of teaching method and create a second scatterplot displaying satisfaction score as a function of teaching method. Using R, run one-way ANOVA tests for this dataset and analyze the resulting p-values. 3 Does there appear to be an association between either test score or satisfaction score and teaching method? 4 Next, create a scatterplot of test score versus satisfaction score. Display data for all three methods on the same plot. 5 Is there a correlation between test scores and satisfaction scores? Please proceed with R... 2 2 2 2 2 2 2 3 3 3 3 3 3 3 3 3 3 3 3 3 3 3 3 3.033 3.022 3.012 3.004 3.003 3.018 3.015 3.013 3.036 3.024 3.03 3.017 3.002 3.001 3.005 3.036 2.997 3.015 3.017 3.029 3.048 3.015 3.04 3.017 3.03 3.027 3.027 3.027 3.03 3.024 3.039 3.007 3.041 3.022 3.014 3.013 3.017 3.02 3.01 3.026 2.985 3.033 3.021 3.023 3.002 3.012 1 First, create one scatterplot displaying test score as a function of teaching method and create a second scatterplot displaying satisfaction score as a function of teaching method. Using R, run one-way ANOVA tests for this dataset and analyze the resulting p-values. Does there appear to be an association between either test score or satisfaction score and teaching method? Next, create a scatterplot of test score versus satisfaction score. Display data for all three methods on the same plot. Is there a correlation between test scores and satisfaction scores? 2 3 4 5

View Answer
divider
BEST MATCH

Shared Writing: APA Goal 3: Ethical and Social Responsibility: Sensation and Perception There is a minimum of 140 characters required to post and earn points. If submitted, your response can be viewed by your classmates and instructor, and you can participate in the class discussion. One of your authors was once involved in a research study where a newly developed pain drug was being tested. All participants completed a series of tasks intended to represent various types of somatic pain (e.g., a sharp, fast pain, a dull ache, etc.), and were asked to report how much pain they experienced during each task. The pain series was completed both during an inititial visit to the lab, and during a second visit about a week later. Prior to completing the tasks during the second visit, participants received either the new pain drug, or a placebo. What primary ethical guidelines apply to this experiment? Would any other guidelines apply if the study participants were made up of a group of patients actively receiving treatment for a pain disorder?

View Answer
divider
BEST MATCH

(a) You have the following capacity curve. Income from Work Ye Inherited Income Suppose there is a major shock in household income due to, let's say, the main and the sole earning member of the household losing their job. Show what happens to the capacity curve in this case if a poverty trap were to emerge from this situation. Explain, in no more than 3 sentences, your graphical answer. (5 points) (b) Here are some examples of expenditures. Budget 1: 20 rupees; spend 5 rupees on clothing/housing, 15 rupees on food. Budget 2: 30 rupees; spend 5 rupees on clothing/housing, 25 rupees on food. In the example, a 50% increase in income (from 20 to 30 rupees) leads to a 66% increase in food expenditures (from 15 to 25 rupees). Diving the two is called an elasticity: by what percentage does food expenditure increase as income increases by one percent? In this case 66/50 = 1.32 -> elastic (slope >1) If there is a nutrition poverty trap, this elasticity should be very high for the poor. Based on this information, suppose income increases from 30 rupees to 45 rupees, and spending on food increases from 25 rupees to 30 rupees. Would you say there's a nutrition poverty trap in this case? Hint: Calculate % increase in income, % increase in food expenditure, and divide them both to get elasticity. (5 points)

View Answer
divider
BEST MATCH

Evaluate the expression under the given conditions.\\ sin(2\theta); sin(\theta) = \frac{1}{3}, \theta in Quadrant II

View Answer
divider
BEST MATCH

How much aluminum oxide and how much carbon are needed to prepare 589 g of aluminum by the balanced chemical reaction (below) if the reaction proceeds to 77.0% yield? $2Al_2O_3(s) + 3C(s) \longrightarrow 4Al(s) + 3CO_2(g)$ 1st attempt Part 1 (1 point) $g Al_2O_3$ Part 2 (1 point) g C

View Answer
divider