You work for a child car seat manufacturer. Your boss hands you some data “BUS 712 Spring 24 project data” and asks for your help in answering the CEO’s questions below.
1. What is the average annual units of car seats sold in each store? How consistent or similar are sales across the stores? In other words, how far away from the average are a typical store’s sales?
2. What is the proportion of stores that display our car seats poorly? What is the proportion that display them well?
3. How strong is the correlation between our unit sales and the competitors’ prices? Based on this, do you think we should be making decisions based on our competitors’ prices?
4. If store sales follow a normal distribution, what is the probability the next store in which we decide to sell our car seats achieves more than 1,000 unit sales per year?
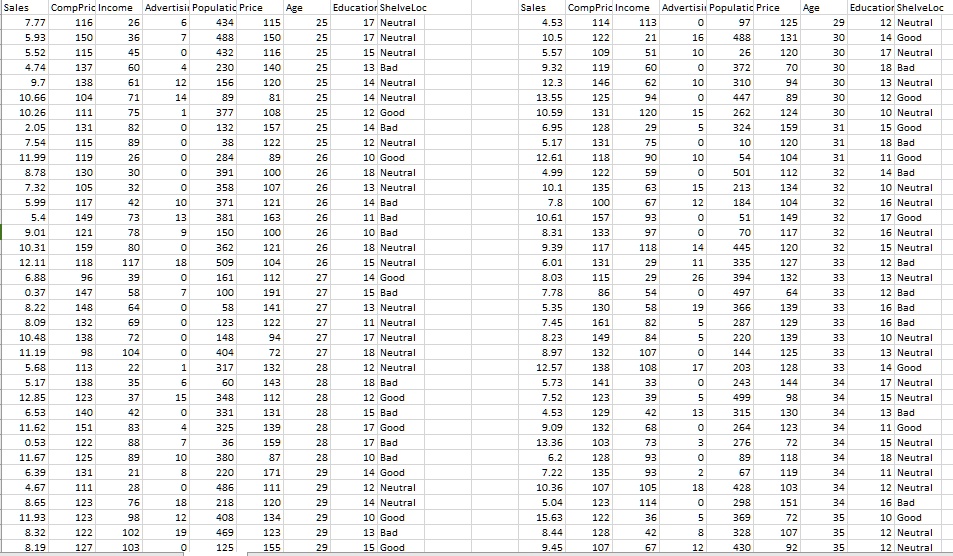
Sales CompPric Income Advertising Population Price Age Education ShelveLoc 7.77 116 26 6 434 115 25 17 Neutral 5.93 150 36 7 488 150 25 17 Neutral 5.52 115 45 0 432 116 25 15 Neutral 4.74 137 60 4 230 140 25 13 Bad 9.7 138 61 12 156 120 25 14 Neutral 10.66 104 71 14 89 81 25 14 Neutral 10.26 111 75 1 377 108 25 12 Poor 2.05 131 82 132 157 25 14 Bad 7.54 115 89 0 122 25 12 Neutral 11.99 119 26 284 89 26 10 Poor 8.78 130 30 391 100 26 18 Neutral 7.32 105 32 0 358 107 26 13 Neutral 5.99 117 42 10 371 121 26 14 Bad 5.4 149 73 13 381 163 26 11 Bad 9.01 121 9 150 100 26 10 Bad 10.31 159 80 362 121 26 18 Neutral 12.11 118 117 18 509 104 26 15 Neutral 6.88 96 0 161 112 27 14 Good 147 58 7 100 191 27 15 Bad 8.22 148 64 0 58 141 27 13 Neutral 8.09 132 69 0 123 122 27 11 Neutral 10.48 138 72 148 94 27 17 Neutral 11.19 98 104 0 404 72 27 18 Neutral 5.68 113 22 1 317 132 28 12 Neutral 5.17 138 35 6 60 143 28 18 Bad 12.85 123 37 15 348 112 28 12 Poor 6.53 140 42 0 331 131 28 15 Bad 11.62 151 8 4 325 139 28 17 Poor 0.53 122 88 7 36 159 28 17 Bad 11.67 125 89 10 380 87 28 10 Bad 6.39 131 21 220 171 29 14 Poor 4.67 111 28 486 111 29 12 Neutral 8.65 123 76 18 218 120 29 14 Neutral 11.93 123 98 12 408 134 29 10 Good 8.32 122 102 19 469 123 29 13 Bad 8.19 127 103 0 125 155 29 15 Good
Sales CompPric Income Advertising Population Price Age Education ShelveLoc 4.53 114 113 0 97 125 29 12 Neutral 10.5 122 21 16 488 131 30 14 Good 5.57 109 51 10 26 120 30 17 Neutral 9.32 119 60 0 372 20 30 18 Bad 12.3 146 62 10 310 94 30 13 Neutral 13.55 125 94 0 447 89 30 12 Good 10.59 131 120 15 262 124 30 10 Neutral 6.95 128 29 5 324 159 31 15 Good 5.17 131 75 0 10 120 31 18 Bad 12.61 118 90 10 54 104 31 11 Good 4.99 122 59 0 501 112 32 14 Bad 10.1 135 63 15 213 134 32 10 Neutral 100 67 12 184 104 32 16 Neutral 10.61 157 93 0 51 149 32 17 Poor 8.31 133 97 0 70 117 32 16 Neutral 9.39 117 118 14 445 120 32 15 Neutral 6.01 131 29 11 SEE 127 33 12 Bad 8.03 115 29 26 394 132 13 Neutral 7.78 86 54 0 497 64 13 Bad 5.35 130 58 19 366 139 33 16 Bad 7.45 161 82 5 287 129 33 16 Bad 8.23 149 84 5 220 139 13 Neutral 8.97 132 107 0 144 125 33 13 Neutral 12.57 138 108 17 203 128 14 Good 5.73 141 33 0 243 144 34 17 Neutral 7.52 123 6 5 499 98 34 15 Neutral 4.53 129 42 13 315 130 34 13 Bad 9.09 132 68 0 264 123 34 11 Good 13.36 103 73 3 276 72 34 15 Neutral 6.2 128 6 0 39 118 34 18 Neutral 7.22 135 6 2 67 119 34 11 Neutral 10.36 107 105 18 428 103 34 12 Neutral 5.04 123 114 0 298 151 34 16 Bad 15.63 122 36 5 369 72 35 10 Good 8.44 128 42 328 107 35 12 Neutral 9.45 107 67 12 430 92 35 12 Neutral