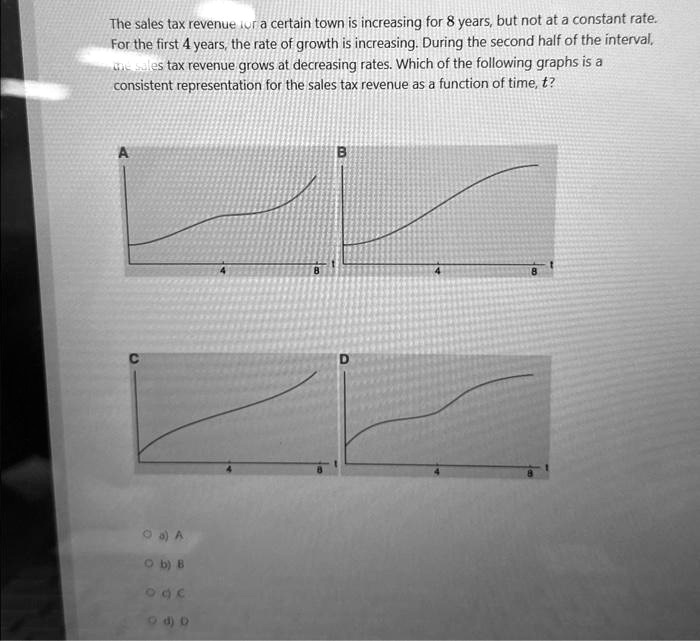
The sales tax revenue for a certain town is increasing for 8 years, but not at a constant rate.
For the first 4 years, the rate of growth is increasing. During the second half of the interval,
the sales tax revenue grows at decreasing rates. Which of the following graphs is a
consistent representation for the sales tax revenue as a function of time, $t$?
A
B
8
8
C
D
a) A
b) B
c) C
d) D