In ongoing economic analyses, the federal government compares per capita incomes not only among different states but also for the same state at different times. Typicaliy, what the federal government finds is that "poor" states tend to stay poor and "wealthy" states tend to stay wealthy.
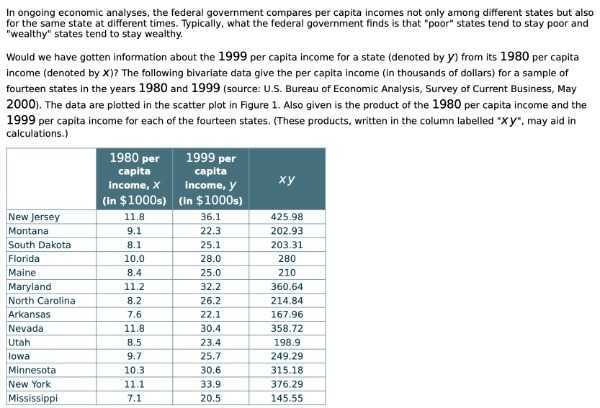
Would we have gotten information about the 1999 per capita income for a state (denoted by \( y \) ) from its 1980 per capita income (denoted by \( X \) )? The following bivariate data give the per capita income (in thousands of dollars) for a sample of fourteen states in the years 1980 and 1999 (source: U.S. Bureau of Economic Analysis, Survey of Current Business, May 2000). The data are plotted in the scatter plot in Figure 1. Also given is the product of the 1980 per capita income and the 1999 per capita income for each of the fourteen states. (These products, written in the column labelled " \( x y \) ", may aid in calculations.)
\begin{tabular}{|l|c|c|c|}
\hline & \begin{tabular}{c}
1980 per \\
capita \\
income, \( x \) \\
(In \( \$ 1000 \) s)
\end{tabular} & \begin{tabular}{c}
1999 per \\
capita \\
income, \( y \) \\
(In \( \$ 1000 \) s)
\end{tabular} & \( x y \) \\
\hline New Jersey & 11.8 & 36.1 & 425.98 \\
\hline Montana & 9.1 & 22.3 & 202.93 \\
\hline South Dakota & 8.1 & 25.1 & 203.31 \\
\hline Florida & 10.0 & 28.0 & 280 \\
\hline Maine & 8.4 & 25.0 & 210 \\
\hline Maryland & 11.2 & 32.2 & 360.64 \\
\hline North Caralina & 8.2 & 26.2 & 214.84 \\
\hline Arkansas & 7.6 & 22.1 & 167.96 \\
\hline Nevada & 11.8 & 30.4 & 358.72 \\
\hline Utah & 8.5 & 23.4 & 198.9 \\
\hline lowa & 9.7 & 25.7 & 249.29 \\
\hline Minnesota & 10.3 & 30.6 & 315.18 \\
\hline New York & 11.1 & 33.9 & 376.29 \\
\hline Mississippi & 7.1 & 20.5 & 145.55 \\
\hline
\end{tabular}