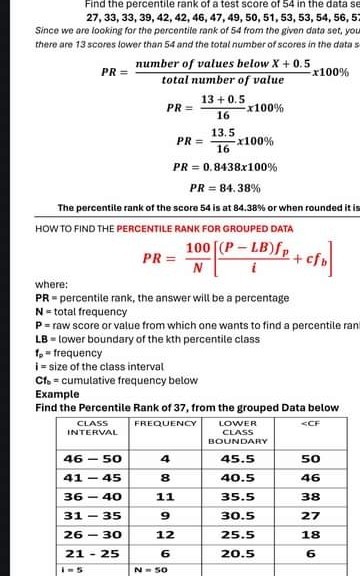
Find the percentile rank of a test score of 54 in the data se
\[
27,33,33,39,42,42,46,47,49,50,51,53,53,54,56,5 ?
\]
Since we are looking for the percentile rank of 54 from the given data set, you there are 13 scores lower than 54 and the fotal number of scores in the data 5
\[
\begin{array}{c}
P R=\frac{\text { number of values below } X+0.5}{\text { total number of value }} \times 100 \% \\
P R=\frac{13+0.5}{16} \times 100 \% \\
P R=\frac{13.5}{16} \times 100 \% \\
P R=0.8438 \times 100 \% \\
P R=84.38 \%
\end{array}
\]
The percentite rank of the score 54 is at \( 84.38 \% \) or when rounded it is
HOWTO FIND THE PERCENTILE RANK FOR GROUPED DATA
\[
P R=\frac{100}{N}\left[\frac{(P-L B) f_{p}}{i}+c f_{b}\right]
\]
where:
\( \mathrm{PR}= \) percentile rank, the answer will be a percentage
\( \mathrm{N}= \) total frequency
\( \mathbf{P}= \) raw score or value from which one wants to find a percentile ran
LB = lower boundary of the \( k \) th percentile class
\( f_{p}= \) frequency
\( \mathbf{i}= \) size of the class interval
\( \mathrm{Cl}_{6}= \) cumulative frequency below
Example
Find the Percentile Rank of 37, from the grouped Data below
\begin{tabular}{|c|c|c|c|}
\hline \begin{tabular}{c}
CLASS \\
INTERVAL
\end{tabular} & FREQUENCY & \begin{tabular}{c}
LOWER \\
CCNSS \\
BOUNDARY
\end{tabular} & <CF \\
\hline \( \mathbf{4 6 - 5 0} \) & \( \mathbf{4} \) & \( \mathbf{4 5 . 5} \) & \( \mathbf{5 0} \) \\
\hline \( \mathbf{4 1 - 4 5} \) & \( \mathbf{8} \) & \( \mathbf{4 0 . 5} \) & \( \mathbf{4 6} \) \\
\hline \( \mathbf{3 6 - 4 0} \) & \( \mathbf{1 1} \) & \( \mathbf{3 5 . 5} \) & \( \mathbf{3 8} \) \\
\hline \( \mathbf{3 1}-\mathbf{3 5} \) & 9 & \( \mathbf{3 0 . 5} \) & 27 \\
\hline \( \mathbf{2 6 - 3 0} \) & \( \mathbf{1 2} \) & \( \mathbf{2 5 . 5} \) & \( \mathbf{1 8} \) \\
\hline \( \mathbf{2 1 - 2 5} \) & \( \mathbf{6} \) & \( \mathbf{2 0 . 5} \) & \( \mathbf{6} \) \\
\hline \( 1=5 \) & N - 50 & & \\
\hline
\end{tabular}