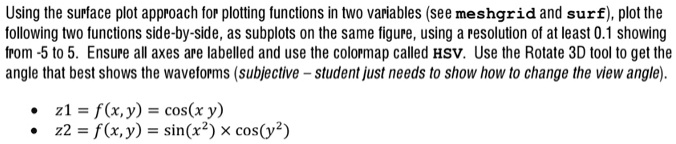
Using the surface plot approach for plotting functions in two variables (see meshgrid and surf), plot the following two functions side-by-side, as subplots on the same figure, using a resolution of at least 0.1 showing from -5 to 5. Ensure all axes are labelled and use the colormap called HSV. Use the Rotate 3D tool to get the angle that best shows the waveforms (subjective - student just needs to show how to change the view angle).
\begin{itemize}
\item $z1 = f(x, y) = \cos(x \, y)$
\item $z2 = f(x, y) = \sin(x^2) \times \cos(y^2)$
\end{itemize}