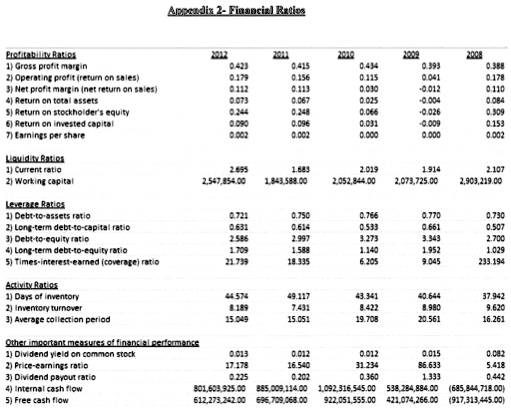
Please show the Financial Ratios for The Walt Disney Company for 2013, 2012, 2011, 2010, 2009, 2008. Your answer needs to be similar to the image below.
Appendix 2 - Financial Ratios
Profitability Ratios
1. Gross profit margin
2. Operating profit (return on sales)
3. Net profit margin (net return on sales)
4. Return on total assets
5. Return on stockholder's equity
6. Return on invested capital
7. Earnings per share
2013 0.423 0.179 0.112 0.073 0.244 0.090 0.002
2012 0.415 0.156 0.113 0.067 0.248 0.096 0.002
2011 0.434 0.115 0.030 0.025 0.066 0.031 0.000
2010 0.660 0.041 -0.012 -0.004 -0.026 0.600 0.000
2009 0.988 0.178 0.110 0.084 0.606 0.153 0.002
Liquidity Ratios
1. Current ratio
2. Working capital
2013 2.695 2,547,854.00
2012 1.683 1,843,588.00
2011 2.019 2,052,844.00
2010 1.914 2,073,725.00
2009 2.107 2,903,219.00
Leverage Ratios
1. Debt-to-assets ratio
2. Long-term debt-to-capital ratio
3. Debt-to-equity ratio
4. Long-term debt-to-equity ratio
5. Times-interest-earned (coverage) ratio
2013 0.721 0.631 2.586 1.709 21.739
2012 0.750 0.614 2.997 1.588 18.335
2011 0.766 0.533 3.273 1.140 6.205
2010 0.770 0.661 3.343 1.952 9.045
2009 0.730 0.507 2.700 1.029 233.194
Activity Ratios
1. Days of inventory
2. Inventory turnover
3. Average collection period
2013 44.574 8.189 15.049
2012 49.117 7.431 15.051
2011 43.341 8.422 19.708
2010 40.644 8.980 20.561
2009 37.942 9.620 16.261
Other important measures of financial performance
1. Dividend yield on common stock
2. Price-earnings ratio
3. Dividend payout ratio
4. Internal cash flow
5. Free cash flow
2013 0.013 17.178 0.225 801,603,925.00 612,273,242.00
2012 0.012 16.540 0.202 885,009,114.00 696,709,068.00
2011 0.012 31.234 0.360 1,092,316,545.00 922,051,555.00
2010 0.015 86.633 1.333 538,284,884.00 421,074,266.00
2009 0.082 5.418 0.442 (685,844,718.00) (917,313,445.00)