Use the parametric equations to complete the following.
(a) Make a table of values for $t = 0, 1, 2, 3$.
(b) Plot the points from the table and graph the curve for $0 \le t \le 3$. Add arrows to show how the curve is traced out.
(c) Describe the curve.
$x = t + 10$, $y = (t - 1)^2$
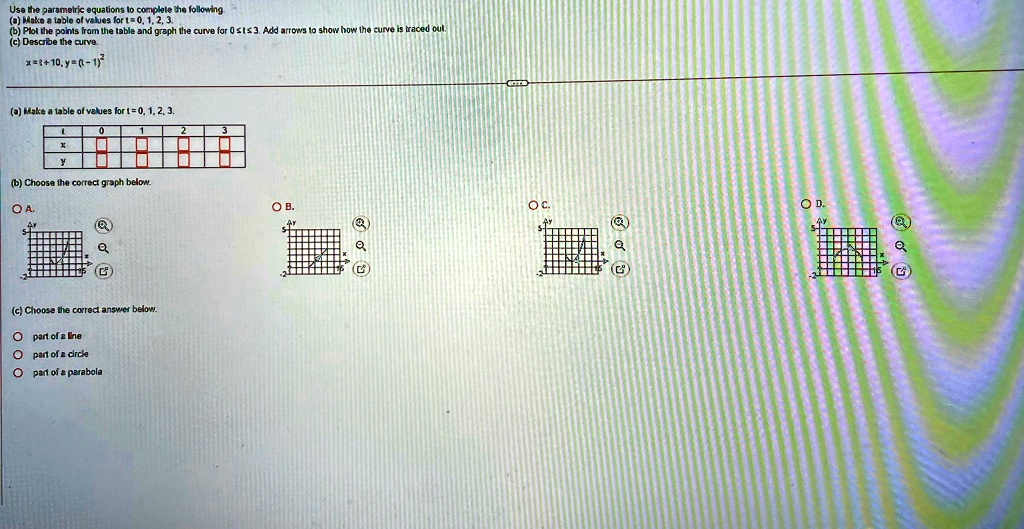
(a) Make a table of values for $t = 0, 1, 2, 3$.
(b) Choose the correct graph below.
(c) Choose the correct answer below.
$\circ$ part of a line
$\circ$ part of a circle
$\circ$ part of a parabola