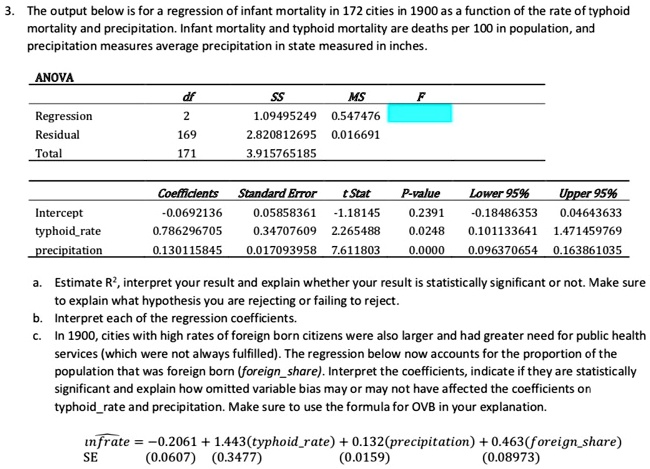
The output below is for a regression of infant mortality in 172 cities in 1900 as a function of the rate of typhoid mortality and precipitation. Infant mortality and typhoid mortality are deaths per 100 in population, and precipitation measures average precipitation in the state measured in inches.
ANOVA
df 2 169 171
SS MS 1.09495249 0.547476 2.820812695 0.016691 3.915765185
F
Regression Residual Total
Coefficients 0.0692136 0.786296705
t Stat 0.05858361 1.18145 0.34707609 2.265488
P-value 0.2391 0.0248 0.0000
Lower 95% -0.18486353
Upper 95% 0.04643633 1.471459769
Intercept typhoid_rate precipitation
0.101133641
0.130115845
0.017093958 7.611803
0.096370654
0.163861035
a. Estimate R, interpret your result and explain whether your result is statistically significant or not. Make sure to explain what hypothesis you are rejecting or failing to reject.
b. Interpret each of the regression coefficients. In 1900, cities with high rates of foreign-born citizens were also larger and had a greater need for public health services (which were not always fulfilled). The regression below now accounts for the proportion of the population that was foreign-born (foreign_share). Interpret the coefficients, indicate if they are statistically significant, and explain how omitted variable bias may or may not have affected the coefficients on typhoid_rate and precipitation. Make sure to use the formula for OVB in your explanation.
unfrate = -0.2061 + 1.443typhoid_rate + 0.132precipitation + 0.463(foreign_share) SE (0.0607)(0.3477) (0.0159) (0.08973)