nber of partners data
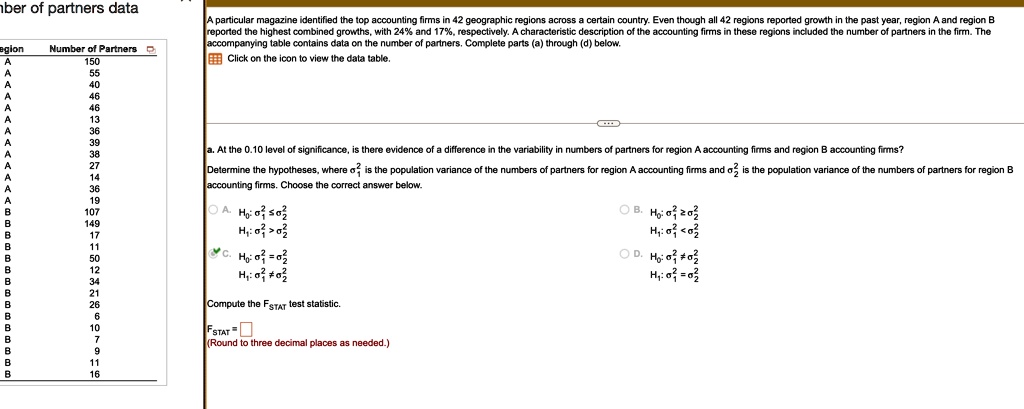
A particular magazine identified the top accounting firms in 42 geographic regions across a certain country. Even though all 42 regions reported growth in the past year, region A and region B
reported the highest combined growths, with 24% and 17%, respectively. A characteristic description of the accounting firms in these regions included the number of partners in the firm. The
accompanying table contains data on the number of partners. Complete parts (a) through (d) below.
Click on the icon to view the data table.
egion
Number of Partners
150
55
40
46
46
13
36
39
38
27
14
36
19
107
149
17
11
50
12
34
21
26
6
10
7
9
11
B
16
a. At the 0.10 level of significance, is there evidence of a difference in the variability in numbers of partners for region A accounting firms and region B accounting firms?
Determine the hypotheses, where $\sigma_1^2$ is the population variance of the numbers of partners for region A accounting firms and $\sigma_2^2$ is the population variance of the numbers of partners for region B
accounting firms. Choose the correct answer below.
? ?. $H_0: \sigma_1^2 \leq \sigma_2^2$
$H_1: \sigma_1^2 > \sigma_2^2$
Compute the FSTAT test statistic.
$F_{STAT}$ =
(Round to three decimal places as needed.)
? ?. $H_0: \sigma_1^2 \geq \sigma_2^2$
$H_1: \sigma_1^2 < \sigma_2^2$
OD. $H_0: \sigma_1^2 = \sigma_2^2$
$H_1: \sigma_1^2 \neq \sigma_2^2$