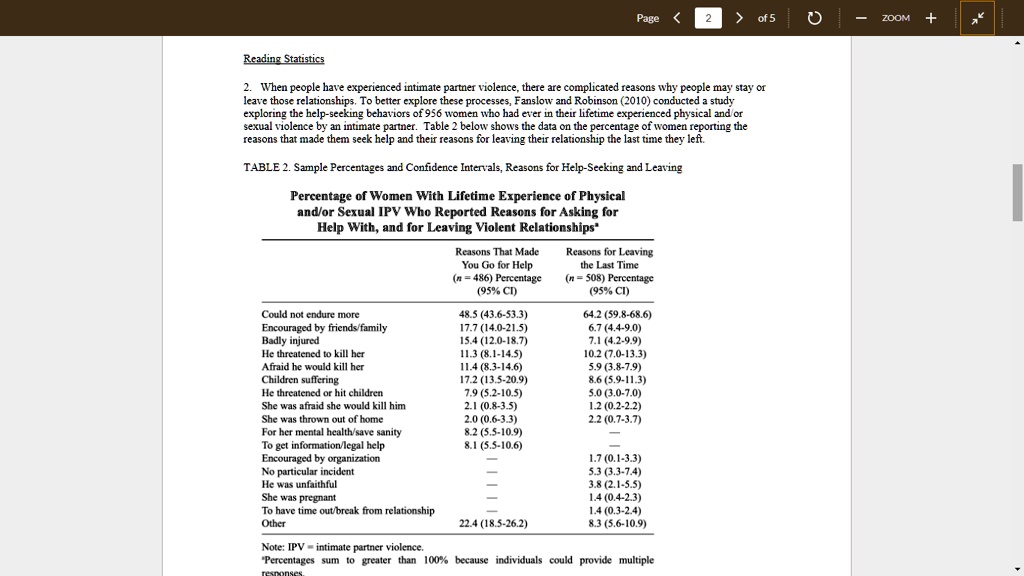
a. Fully interpret the 95% confidence intervals for the percentages of women who said they “could not enduremore” for both the help-seeking and leaving categories. What is the substantive meaning of these results?b. Is there a significant population-level difference in the percentages of women who sought help and those who leftrelationships after a partner threatened to kill them? How do you know this? (HINT: look at the confidenceintervals, not the sample percentages.) c. Does the reason of “children suffering” have a higher percentage of women seeking help or leaving therelationship? Be sure to cite evidence in your answer.d. Using evidence from Table 2, what overall conclusion can you draw about reasons for seeking help vs. leaving anabusive relationship? Based on the evidence in Table 2, what interventions would you suggest?
Page
2 > of 5
ZOOM
+
Reading Statistics
2 When people have experienced intimate partner violence, there are complicated reasons why people may stay or leave those relationships. To better explore these processes, Fanslow and Robinson (2010) conducted a study exploring the help-seeking behaviors of 956 women who had ever in their lifetime experienced physical and/or sexual violence by an intimate partner. Table 2 below shows the data on the percentage of women reporting the reasons that made them seek help and their reasons for leaving their relationship the last time they left.
TABLE 2. Sample Percentages and Confidence Intervals, Reasons for Help-Seeking and Leaving
Percentage of Women With Lifetime Experience of Physical and/or Sexual IPV Who Reported Reasons for Asking for Help With, and for Leaving Violent Relationshipsa
Reasons That Made You Go for Help n=486 Percentage (95%CI) 48.5 (43.6-53.3) 17.7 (14.0-21.5) 15.4 (12.0-18.7) 11.3 (8.1-14.5) 11.4 (8.3-14.6) 17.2 (13.5-20.9) 7.9 (5.2-10.5) 2.1 (0.8-3.5) 2.0 (0.6-3.3) 8.2 (5.5-10.9) 8.1 (5.5-10.6)
Reasons for Leaving the Last Time n=508Percentage (95% CI)
Could not endure more Encouraged by friends/family Badly injured He threatened to kill her Afraid he would kill her Children suffering He threatened or hit children She was afraid she would kill him She was thrown out of home For her mental health/save sanity To get information/legal help Encouraged by organization No particular incident He was unfaithful She was pregnant To have time out/break from relationship Other
64.2 (59.8-68.6) 6.7 (4.4-9.0) 7.1 (4.2-9.9) 10.2 (7.0-13.3) 5.9 (3.8-7.9) 8.6 (5.9-11.3) 5.0 (3.0-7.0) 1.2 (0.2-2.2) 2.2 (0.7-3.7)
1.7 (0.1-3.3) 5.3 (3.3-7.4) 3.8 (2.1-5.5) 1.4 (0.4-2.3) 1.4 (0.3-2.4) 8.3 (5.6-10.9)
22.4 (18.5-26.2)
Note: IPV = intimate partner violence. Percentages sum to greater than 100% because individuals could provide multiple