QUESTION 3
(16)
HBAT management has long been interested in more accurately predicting the satisfaction level of
its customers. If successful, it would provide a better foundation for their marketing efforts. To this
end, researchers at HBAT proposed that multiple regression analysis should be attempted to predict
the customer satisfaction based on their perceptions of HBAT's performance. In addition to finding a
way to accurately predict satisfaction, the researchers also were interested in identifying the factors
that lead to increased satisfaction for use in differentiated marketing campaigns. Thus, explanation
was a critical objective since this analysis was intended to provide management with the key
elements necessary to improve customer satisfaction. To apply the regression procedure,
researchers selected customer satisfaction ($X_{19}$) as the dependent variable (Y) to be predicted by
13 independent variables representing perceptions of HBAT's performance ($X_1$ to $X_{18}$). Brief
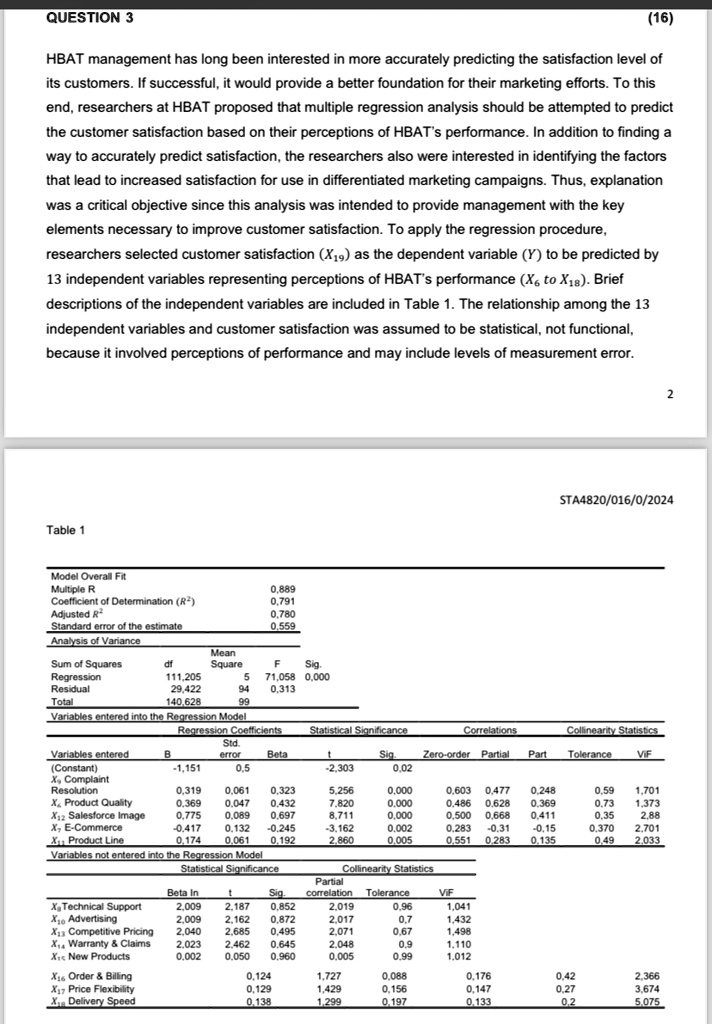
descriptions of the independent variables are included in Table 1. The relationship among the 13
independent variables and customer satisfaction was assumed to be statistical, not functional,
because it involved perceptions of performance and may include levels of measurement error.
Table 1
Model Overall Fit
Multiple R
0,889
Coefficient of Determination (R2)
0,791
Adjusted R2
0,780
Standard error of the estimate
0,559
Analysis of Variance
Mean
Sum of Squares
df
Square
F Sig.
Regression
111,205
5 71,058 0,000
Residual
29,422
94
0,313
Total
140.628
99
Variables entered into the Regression Model
Regression Coefficients
Statistical Significance
Correlations
Collinearity Statistics
Std.
Variables entered
B
error
Beta
(Constant)
-1,151
0.5
-2,303
Sig. Zero-order Partial Part
0,02
Tolerance
ViF
X, Complaint
Resolution
0,319 0,061 0,323
5,256
0,000
0,603 0,477
0,248
0,59 1,701
X Product Quality
0,369 0,047 0,432
7,820
0.000
0,486 0.628
0.369
0,73 1,373
X12 Salesforce Image
0.775 0,089 0,697
8.711
0,000
0,500 0,668
0,411
0,35 2.88
X, E-Commerce
-0.417 0.132 -0.245
-3,162
0.002
0.283 -0,31
-0.15
0.370 2,701
X11 Product Line
0.174 0,061 0.192
2,860
0,005
0,551 0,283
0.135
0,49 2,033
Variables not entered into the Regression Model
Statistical Significance
Collinearity Statistics
Partial
Beta In
t
Sig.
correlation Tolerance
ViF
X Technical Support
2,009 2.187 0.852
2,019
0.96
1,041
X10 Advertising
2.009 2,162 0.872
2,017
0.7
1,432
X13 Competitive Pricing
2.040 2,685 0.495
2,071
0.67
1.498
X Warranty & Claims
2.023
2,462 0,645
2,048
0.9
1.110
X1 New Products
0.002
0.050 0,960
0.005
0.99
1.012
X16 Order & Billing
X17 Price Flexibility
X18 Delivery Speed
0.124
1,727
0,088
0,176
0,42
2,366
0.129
1,429
0,156
0.147
0,27
3,674
0.138
1,299
0,197
0,133
0,2
5,075
STA4820/016/0/2024
2