Q3: Understanding Data
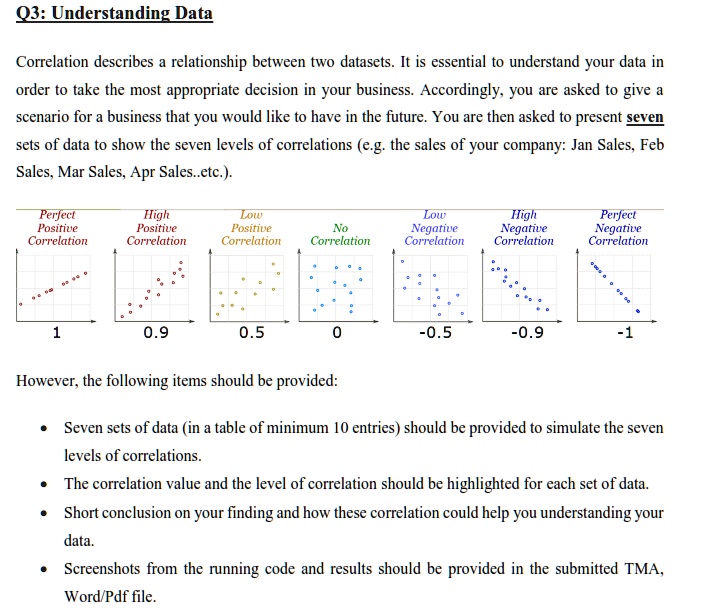
Correlation describes a relationship between two datasets. It is essential to understand your data in
order to take the most appropriate decision in your business. Accordingly, you are asked to give a
scenario for a business that you would like to have in the future. You are then asked to present seven
sets of data to show the seven levels of correlations (e.g. the sales of your company: Jan Sales, Feb
Sales, Mar Sales, Apr Sales..etc.).
Perfect
Positive
Correlation
High
Positive
Correlation
Low
Positive
Correlation
No
Correlation
Low
Negative
Correlation
High
Negative
Correlation
Perfect
Negative
Correlation
1
0.9
0.5
0
-0.5
-0.9
-1
However, the following items should be provided:
• Seven sets of data (in a table of minimum 10 entries) should be provided to simulate the seven
levels of correlations.
• The correlation value and the level of correlation should be highlighted for each set of data.
• Short conclusion on your finding and how these correlation could help you understanding your
data.
• Screenshots from the running code and results should be provided in the submitted TMA,
Word/Pdf file.