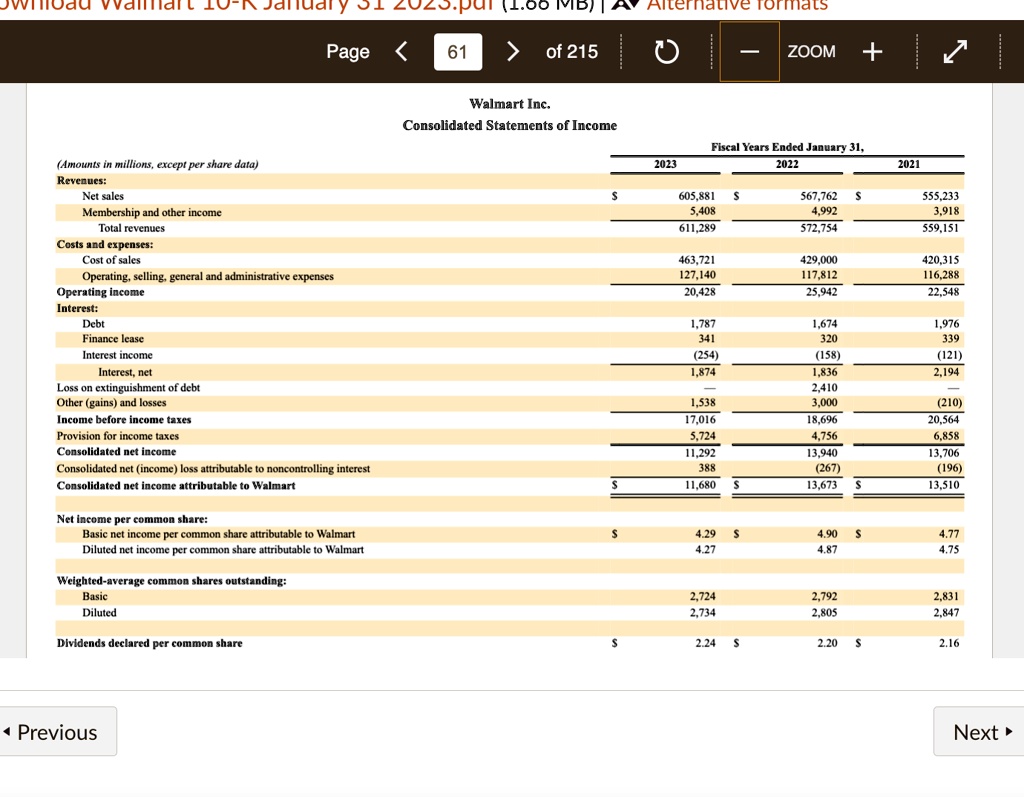
Consider total revenues for Walmart. What is the dollar change, and the percentage
change, from 1-31-2022 to 1-31-2023? And consider net income. What is the dollar
change, and the percentage change, from 1-31-2022 to 1-31-2023? Walmart Inc.
Consolidated Statements of Income
Alternative formats
Page
61
of 215
ZOOM
Walmart Inc.
Consolidated Statements of Income
Fiscal Years Ended January 31, 2022
(Amounts in millions, except per share data) Revenues: Net sales Membership and other income Total revenues Costs and expenses: Cost of sales Operating, selling, general and administrative expenses Operating income Interest: Debt Finance lease Interest income Interest, net Loss on extinguishment of debt Other (gains) and losses Income before income taxes Provision for income taxes Consolidated net income Consolidated net (income) loss attributable to noncontrolling interest Consolidated net income attributable to Walmart
2023
2021
S
605,881 S 5,408 611,289
567,762 S 4,992 572,754
555,233 3,918 559,151
463,721 127,140 20,428
429,000 117,812 25,942
420,315 116,288 22,548
1,787 341 (254) 1,874
1,674 320 (158) 1,836 2,410 3,000 18,696 4,756 13,940 (267) 13,673 S
1,976 339 (121) 2,194
1,538 17,016 5,724 11,292 388 11,680 S
(210) 20,564 6,858 13,706 (196) 13,510
S
Net income per common share: Basic net income per common share attributable to Walmart Diluted net income per common share attributable to Walmart
S
4.29 4.27
4.90 4.87
4.77 4.75
Weighted-average common shares outstanding: Basic Diluted
2,724 2,734
2,792 2,805
2,831 2,847
Dividends declared per common share
S
2.24 S
2.20
S
2.16
Previous
Next