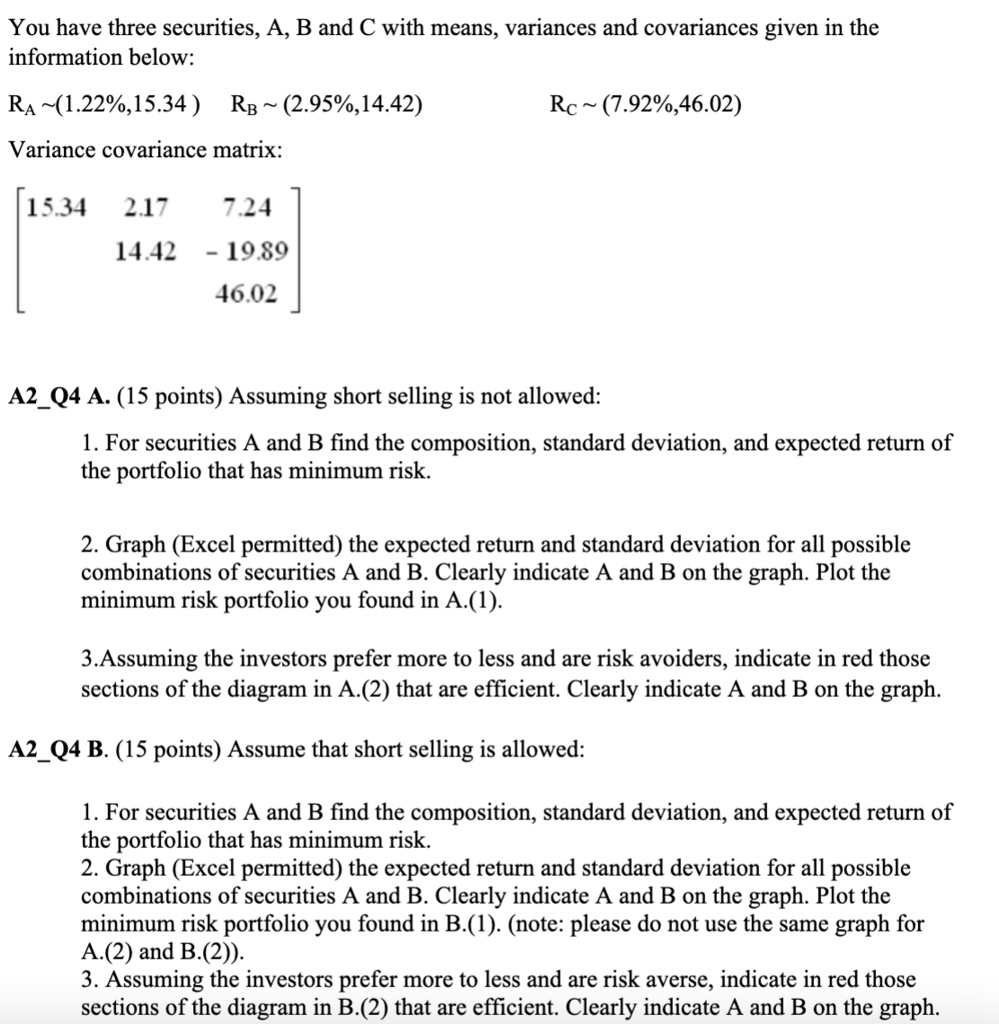
You have three securities, A, B and C with means, variances and covariances given in the information below:
$R_A \sim (1.22\%, 15.34)$ $R_B \sim (2.95\%, 14.42)$ $R_C \sim (7.92\%, 46.02)$
Variance covariance matrix:
$\begin{bmatrix}
15.34 & 2.17 & 7.24 \\
2.17 & 14.42 & -19.89 \\
7.24 & -19.89 & 46.02
\end{bmatrix}$
A2_Q4 A. (15 points) Assuming short selling is not allowed:
1. For securities A and B find the composition, standard deviation, and expected return of the portfolio that has minimum risk.
2. Graph (Excel permitted) the expected return and standard deviation for all possible combinations of securities A and B. Clearly indicate A and B on the graph. Plot the minimum risk portfolio you found in A.(1).
3.Assuming the investors prefer more to less and are risk avoiders, indicate in red those sections of the diagram in A.(2) that are efficient. Clearly indicate A and B on the graph.
A2_Q4 B. (15 points) Assume that short selling is allowed:
1. For securities A and B find the composition, standard deviation, and expected return of the portfolio that has minimum risk.
2. Graph (Excel permitted) the expected return and standard deviation for all possible combinations of securities A and B. Clearly indicate A and B on the graph. Plot the minimum risk portfolio you found in B.(1). (note: please do not use the same graph for A.(2) and B.(2)).
3. Assuming the investors prefer more to less and are risk averse, indicate in red those sections of the diagram in B.(2) that are efficient. Clearly indicate A and B on the graph.